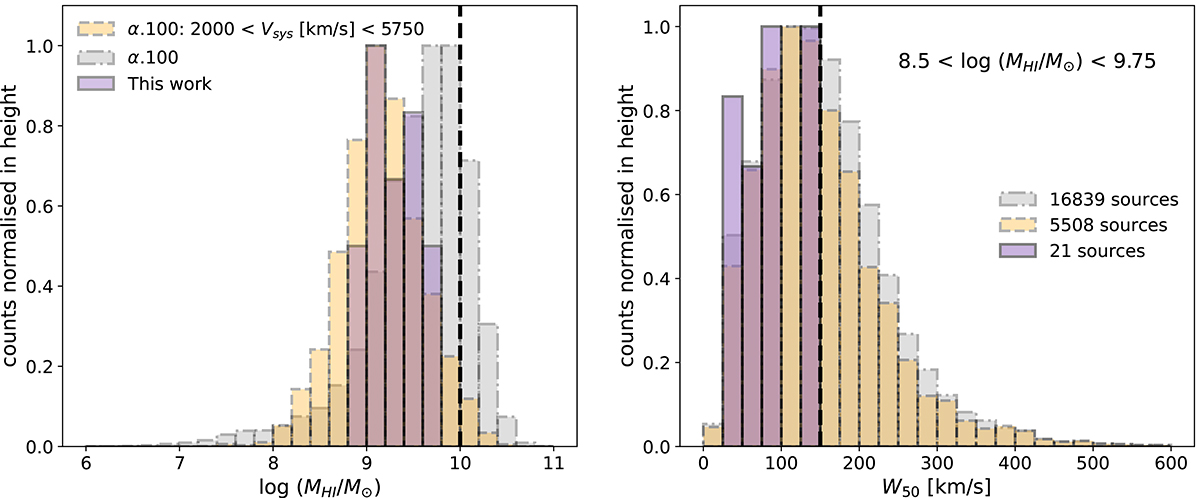
Fig. 5.
Download original image
Comparison of global H I properties between our and the ALFALFA sample. Left: Histogram of MH I normalized to the same maximum bin height with α. 100 sample in gray, the α. 100 volume limited subsample with 2000 < Vsys [km s−1] < 5750 in orange, and our sample in purple. Right: Histogram of log W50 normalized to the same maximum bin height for the H I mass range between 108.5 − 109.75 M⊙. Colors are the same as in the left panel.
Current usage metrics show cumulative count of Article Views (full-text article views including HTML views, PDF and ePub downloads, according to the available data) and Abstracts Views on Vision4Press platform.
Data correspond to usage on the plateform after 2015. The current usage metrics is available 48-96 hours after online publication and is updated daily on week days.
Initial download of the metrics may take a while.