Fig. 4.
Download original image
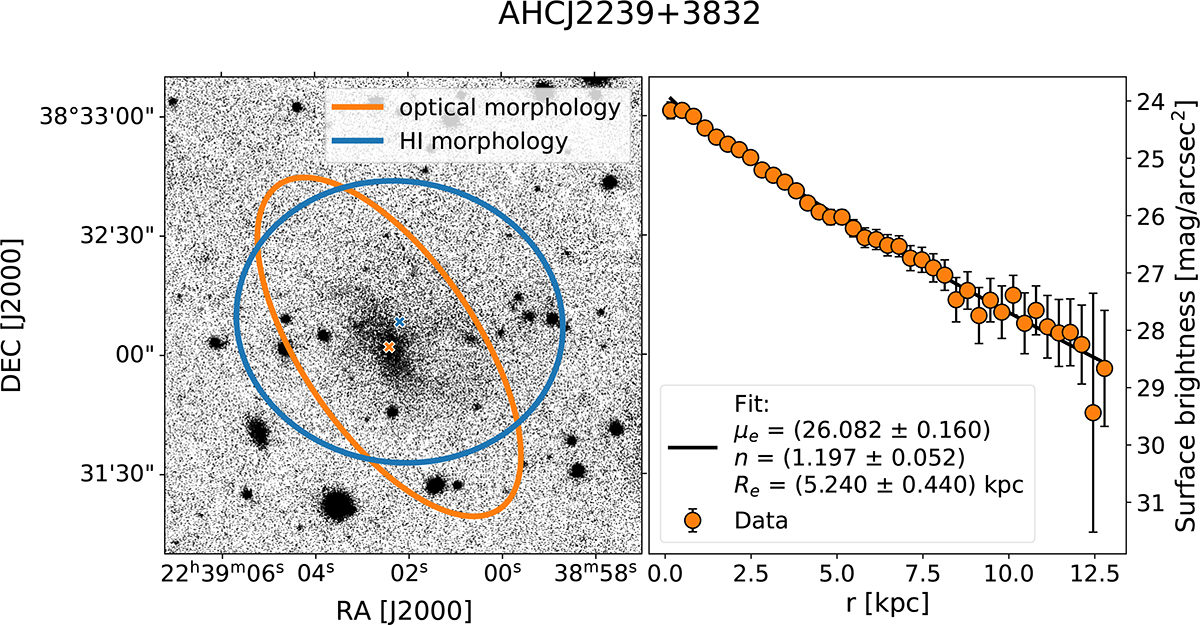
Photometry in the i-band of AHCJ2239+3832. Left: Optical i-band image overlaid with measured geometries from H I morphology (blue) and from i-band isophotal fitting (orange). The radius at which the optical geometry is plotted corresponds to the outermost data point in the surface brightness profile. The radius at which the H I geometry is plotted corresponds to the extent of the disk as obtained from CANNUBI. The crosses denote the obtained optical (orange) and H I (blue) centers. Right: Surface brightness profile (orange) and the corresponding best fit with a Sérsic profile (black).
Current usage metrics show cumulative count of Article Views (full-text article views including HTML views, PDF and ePub downloads, according to the available data) and Abstracts Views on Vision4Press platform.
Data correspond to usage on the plateform after 2015. The current usage metrics is available 48-96 hours after online publication and is updated daily on week days.
Initial download of the metrics may take a while.