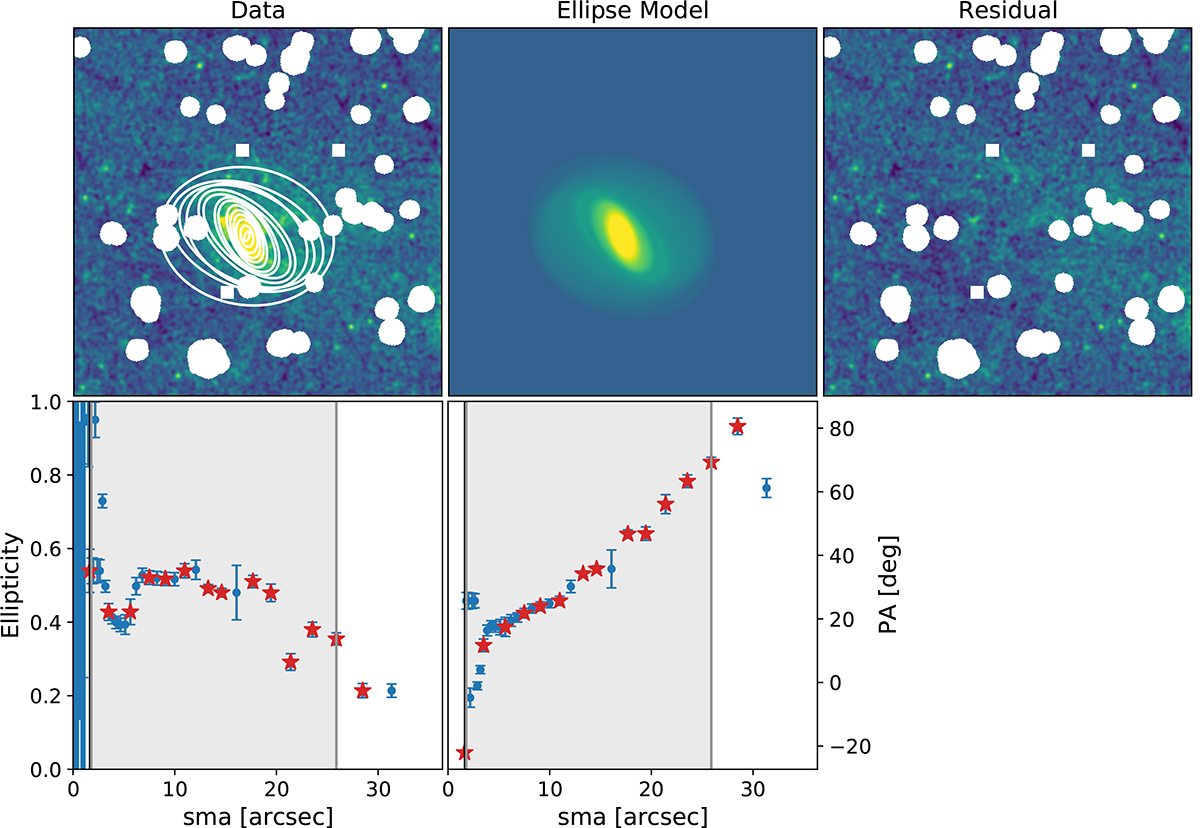
Fig. 3.
Download original image
Isophotal fitting result for AHCJ2239+3832. Upper panels: The leftmost panel shows the smoothed data overlaid with semi-equidistant ellipses along the semi-major axis length whose parameters are marked with red stars in the lower panels. White regions denote masked pixels in the image. The middle panel shows the model built from all fitted ellipses (blue circles in the lower panels), and the rightmost panel shows the residual of the data image and the model image. Lower panels: Ellipticity and position angle as a function of the semi-major axis length from the second run of the fitting algorithm (see Sect. 3.3) are shown as blue circles, with respect to radius from the fixed center position. Red stars denote parameters of semi-equidistant ellipses plotted in the upper leftmost panel. The black vertical line is located at a distance from the center that corresponds to the FWHM of the PSF after the smoothing, and the gray shaded region corresponds to the region in which the final global geometry was measured (using only the semi-equidistant ellipses, see Sect. 3.3).
Current usage metrics show cumulative count of Article Views (full-text article views including HTML views, PDF and ePub downloads, according to the available data) and Abstracts Views on Vision4Press platform.
Data correspond to usage on the plateform after 2015. The current usage metrics is available 48-96 hours after online publication and is updated daily on week days.
Initial download of the metrics may take a while.