Fig. 2.
Download original image
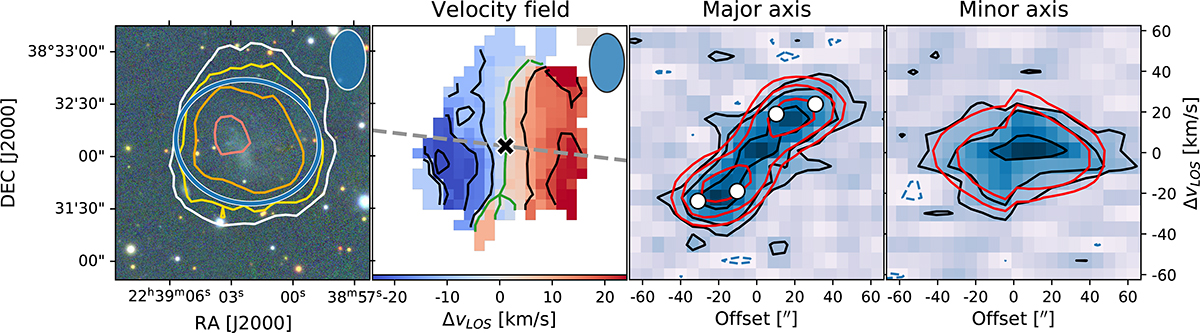
H I kinematics of AHCJ2239+3832. Leftmost: Color-composite image from PS1 g-, r-, and i-bands overlaid with H I contours. Contours are set to start at the level of intensity corresponding to a pseudo 4σ contour (see Sect. 3.2 for explanation) in the total intensity map (white), and grow by a factor of two in intensity toward the redder colors. Lowest contour for AHCJ2239+3832 corresponds to the column density of 7.2 × 1019 cm−2. The overplotted ellipse in blue represents the median geometric parameters obtained from CANNUBI (including the size). Middle left: Velocity field obtained as weighted-mean value from the H I data from 3DBarolo. The black cross represents the best-fit center position and the gray dashed line the kinematic position angle. Contours are given in spacing of 10 km s−1 with the green contour indicating Vsys. Middle right: Position-velocity slice along the major axis with data (blue) and model (red) contours. White points represent the obtained projected rotational velocity of the best fit model. Contours are plotted starting from two times the noise per channel in the cube as reported in Table 1, and grow linearly. Rightmost: Position-velocity slice along the minor axis (perpendicular to the dashed line in the middle left panel) with the same color scheme and contour levels as the middle right panel.
Current usage metrics show cumulative count of Article Views (full-text article views including HTML views, PDF and ePub downloads, according to the available data) and Abstracts Views on Vision4Press platform.
Data correspond to usage on the plateform after 2015. The current usage metrics is available 48-96 hours after online publication and is updated daily on week days.
Initial download of the metrics may take a while.