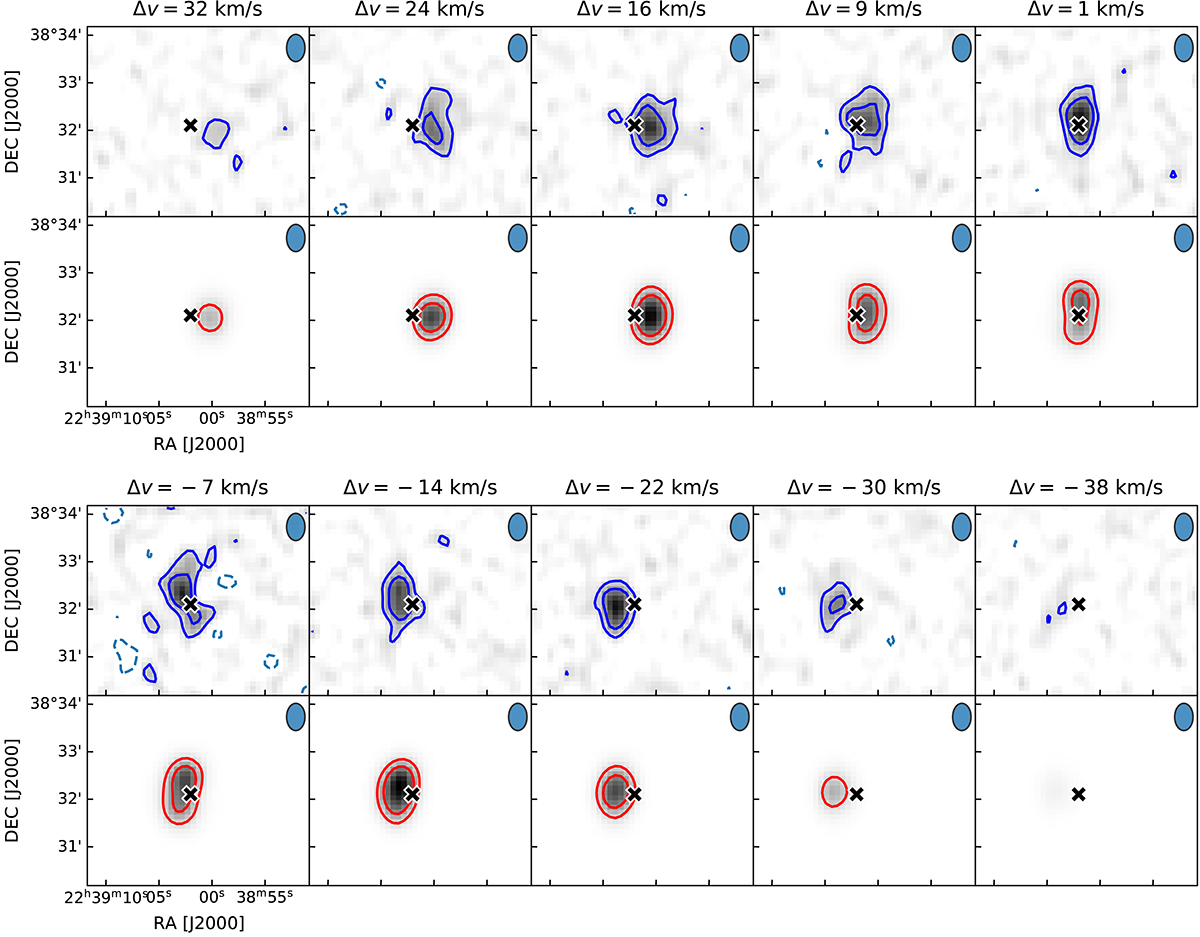
Fig. 1.
Download original image
Comparison between channel maps of AHCJ2239+3832 and its best-fit model. Top panels and blue contours represent the data, while the lower panels and red contours represent the best fit model. Contours are plotted starting from three times the noise per channel in the cube reported in Table 1, and are spaced by a factor of two in intensity. The black X indicates the center of the galaxy, as determined by CANNUBI (see Sect. 3.2).
Current usage metrics show cumulative count of Article Views (full-text article views including HTML views, PDF and ePub downloads, according to the available data) and Abstracts Views on Vision4Press platform.
Data correspond to usage on the plateform after 2015. The current usage metrics is available 48-96 hours after online publication and is updated daily on week days.
Initial download of the metrics may take a while.