Fig. 6
Download original image
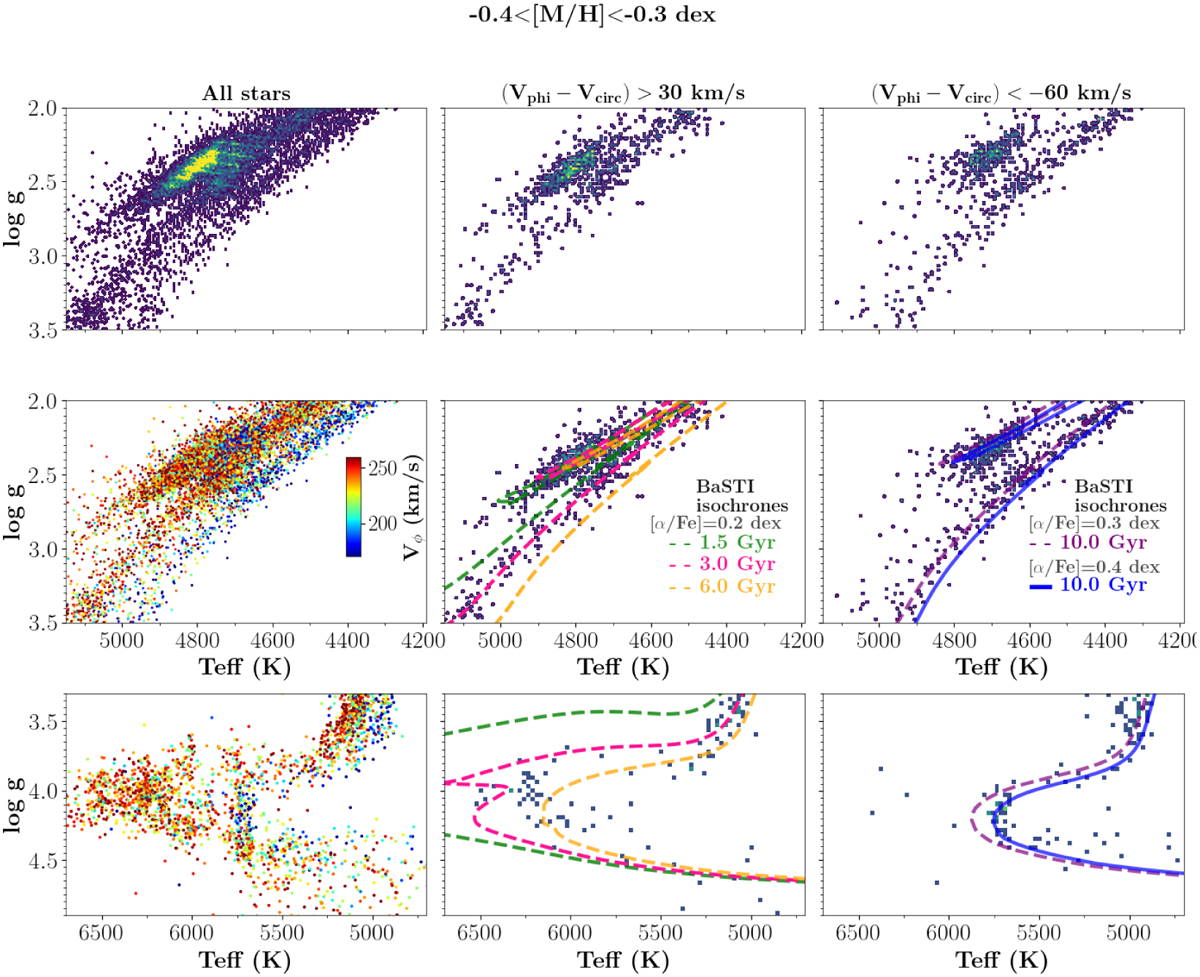
Disc stellar population with [M/H]=−0.35±0.05 dex. The panels show a kinematical decomposition of the RGB and RC (first and second row) and the turn-off (bottom row) features. The left panels show all the selected stars and present the double evolutionary sequences both for giants and dwarfs. The central and right panels show the thin and thick disc populations, respectively, separated thanks to their Vϕ. BaSTI isochrones with different α-enhancements are fitted to the data.
Current usage metrics show cumulative count of Article Views (full-text article views including HTML views, PDF and ePub downloads, according to the available data) and Abstracts Views on Vision4Press platform.
Data correspond to usage on the plateform after 2015. The current usage metrics is available 48-96 hours after online publication and is updated daily on week days.
Initial download of the metrics may take a while.