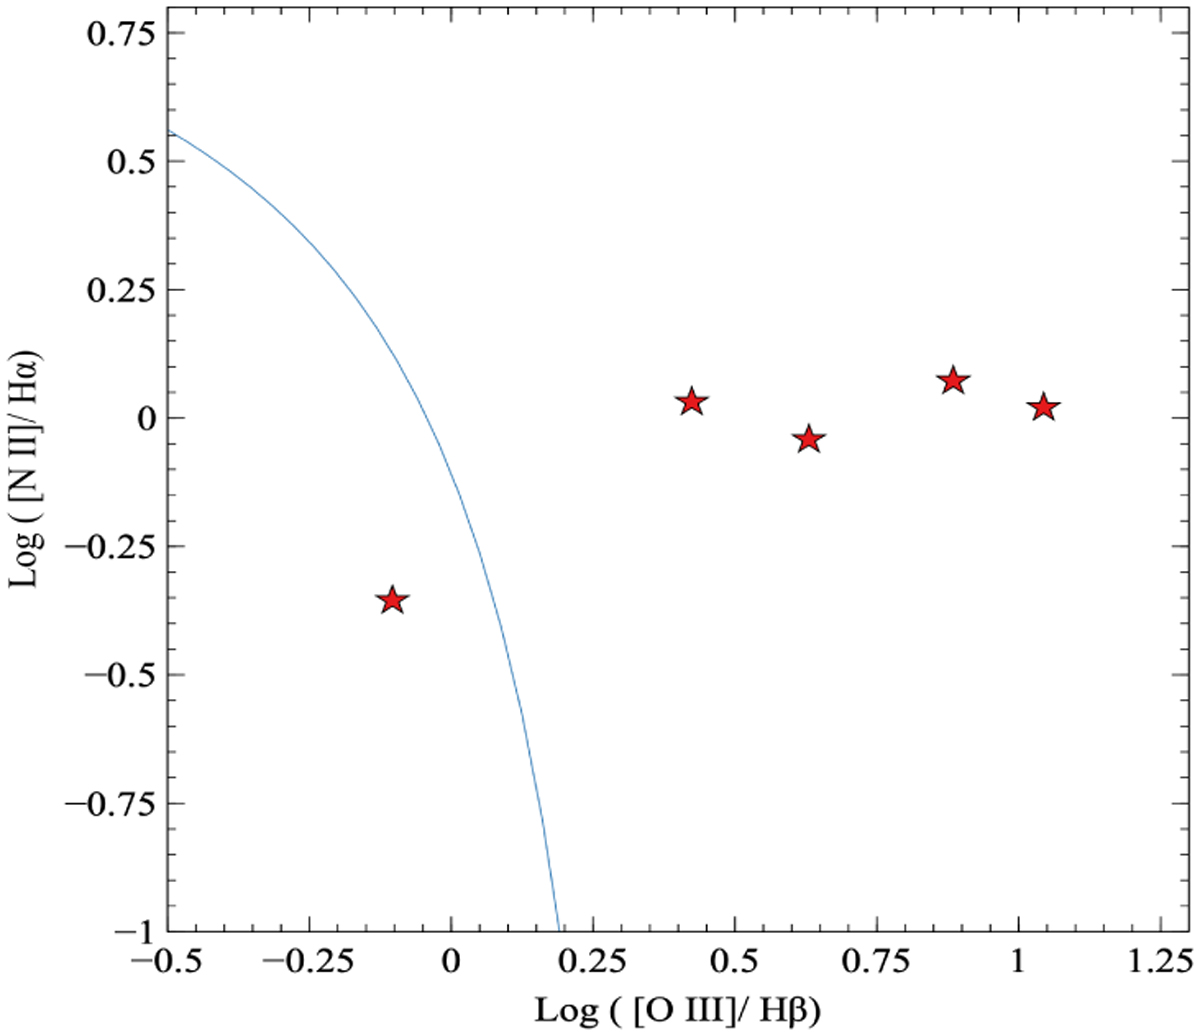
Fig. 9
Download original image
BPT diagram for distinguishing type 2 and star-forming galaxies. The error bars are all less than 0.009 and not visible in the plot. Note that all of the sources, except for SDSS J143010.96+230134.7, are above the theoretical line of Kewley et al. (2013) (right part of the graph separated by the blue line), which serves to discriminate between starburst regions and harder ionization sources.
Current usage metrics show cumulative count of Article Views (full-text article views including HTML views, PDF and ePub downloads, according to the available data) and Abstracts Views on Vision4Press platform.
Data correspond to usage on the plateform after 2015. The current usage metrics is available 48-96 hours after online publication and is updated daily on week days.
Initial download of the metrics may take a while.