Fig. 5
Download original image
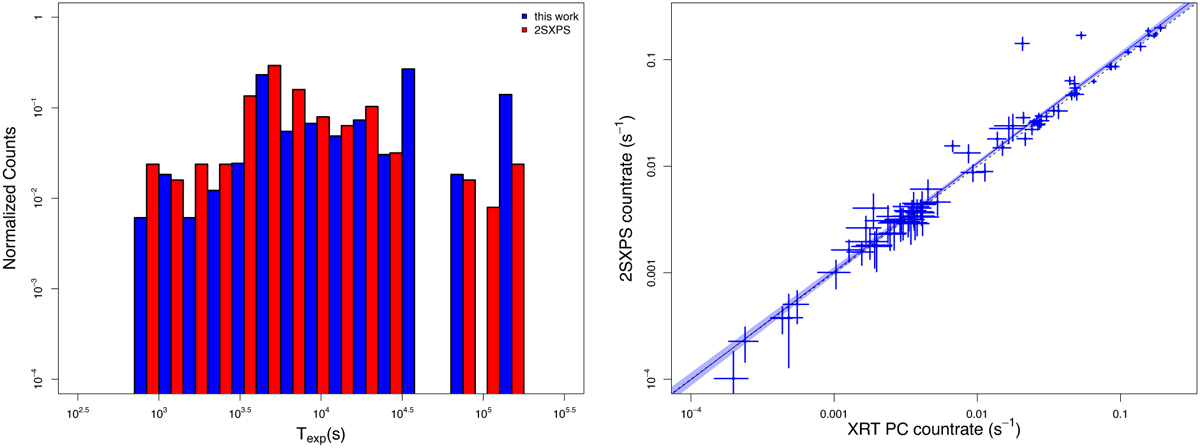
Comparison with the 2SXPS catalog. Left panel: comparison between the exposure of the dataset used in the present work (blue distribution) and in the 2SXPS (red distribution). Right panel: XRT PC count rates reported in the 2SXPS versus those evaluated in the present work for the 78 sources in common (see Sect. 3.4). The 2SXPS count rate has been rescaled to match the energy band used in the present analysis. The blue line indicates the linear regression to the logarithmic data, while the shaded light blue area represents the 1 − σ uncertainty around the best-fit relation. The dashed black line indicates the y = x relation. See Sect. 3.4 for more details.
Current usage metrics show cumulative count of Article Views (full-text article views including HTML views, PDF and ePub downloads, according to the available data) and Abstracts Views on Vision4Press platform.
Data correspond to usage on the plateform after 2015. The current usage metrics is available 48-96 hours after online publication and is updated daily on week days.
Initial download of the metrics may take a while.