Fig. 2
Download original image
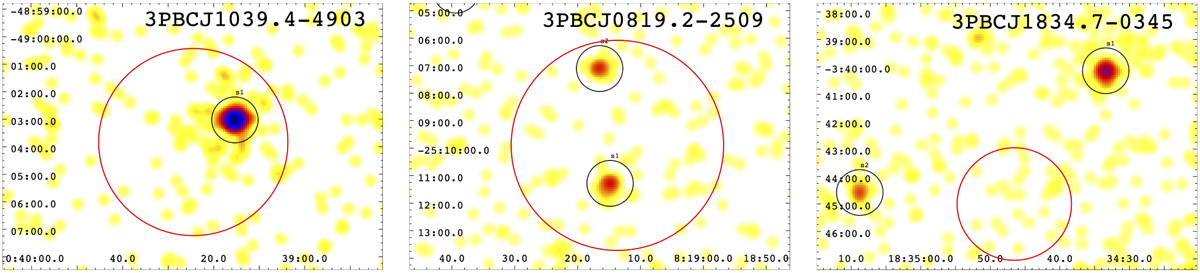
Examples of our XDF flags that label the 3PBC sources. Each panel shows an image from XRT-merged event files, with the red circle indicating the BAT positional uncertainty region and the black circles highlighting the position of a soft X-ray source detected in the Swift-XRT archive. The left panel is an example of a 3PBC source with a single Swift-XRT source found within the BAT positional uncertainty region (red circle), flag x. The center panel is a case of multiple detected Swift-XRT counterparts inside the BAT positional uncertainty, flag m. The right panel is an example of no Swift-XRT counterparts detected within the BAT positional uncertainty region, flag u.
Current usage metrics show cumulative count of Article Views (full-text article views including HTML views, PDF and ePub downloads, according to the available data) and Abstracts Views on Vision4Press platform.
Data correspond to usage on the plateform after 2015. The current usage metrics is available 48-96 hours after online publication and is updated daily on week days.
Initial download of the metrics may take a while.