Open Access
Fig. 1
Download original image
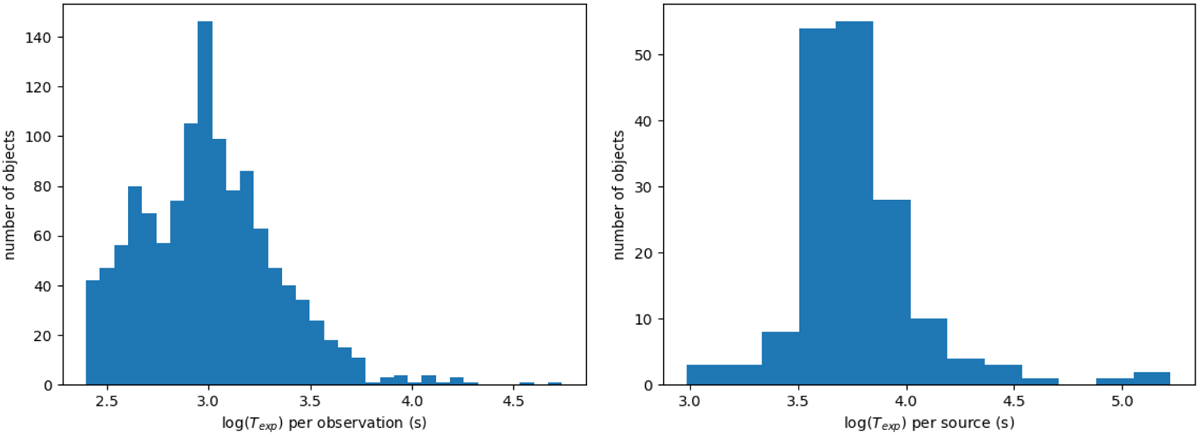
Distribution of Texp for the 1213 Swift-XRT observations analyzed in this work. Left panel: Texp per observation with a mean of 1462 s. Right panel: total Texp per source of the 192 sources for which we found Swift-XRT observations, with a mean of 8864 s.
Current usage metrics show cumulative count of Article Views (full-text article views including HTML views, PDF and ePub downloads, according to the available data) and Abstracts Views on Vision4Press platform.
Data correspond to usage on the plateform after 2015. The current usage metrics is available 48-96 hours after online publication and is updated daily on week days.
Initial download of the metrics may take a while.