Fig. 7.
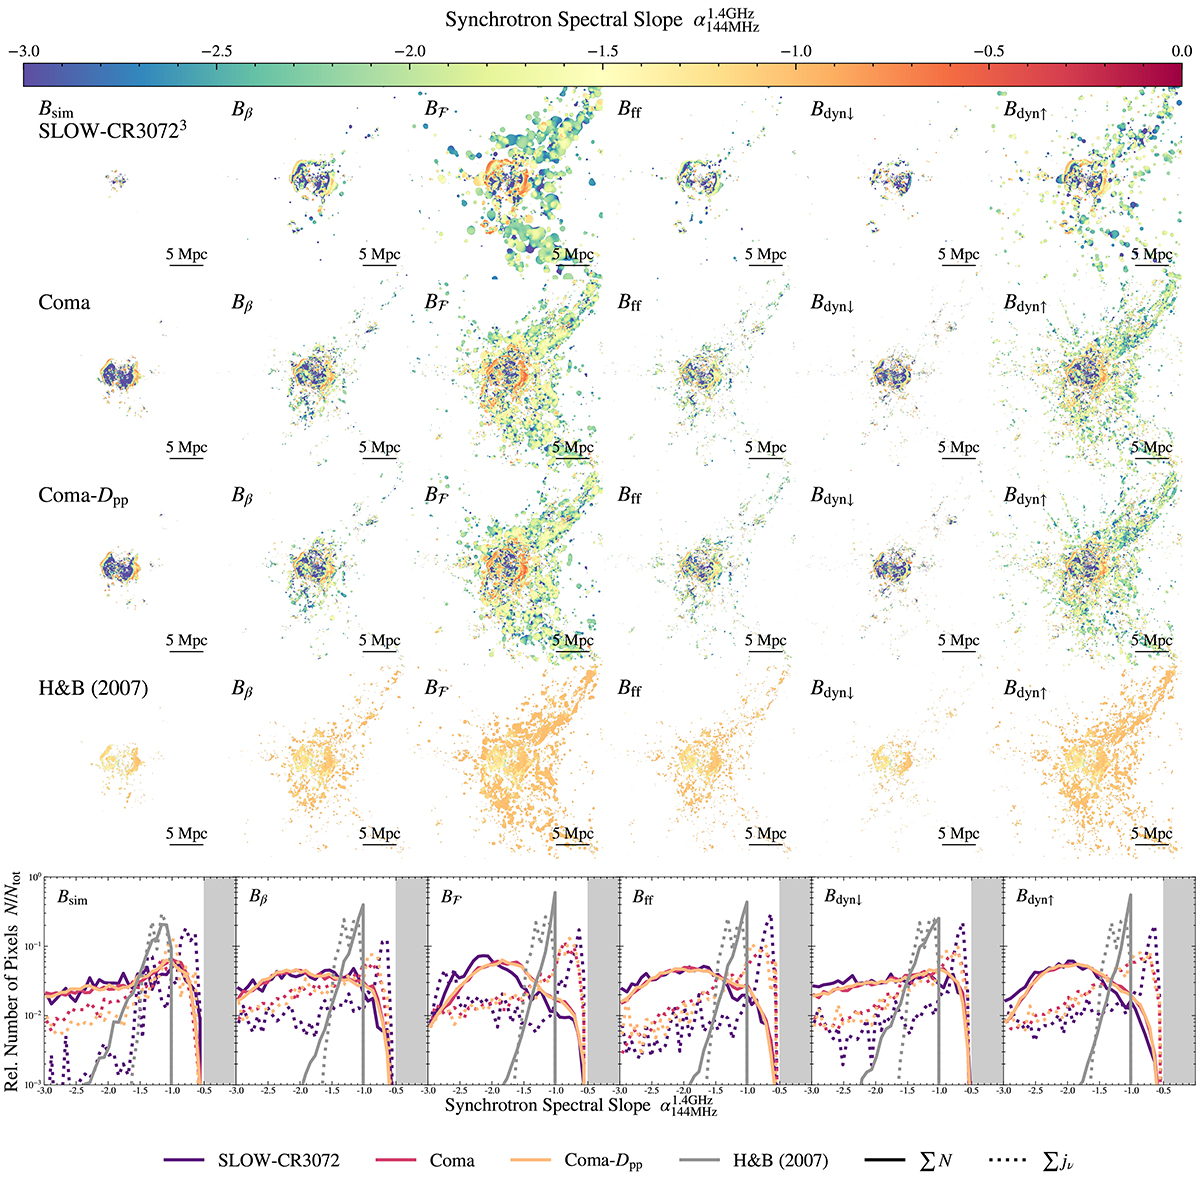
Download original image
Resolved synchrotron spectrum maps accompanying Fig. 6. We constructed the synchrotron slope between the images of Fig. 6 and images with the same resolution at 1.4 GHz by fitting a single power law between the respective pixel values. We impose a surface brightness cutoff for the slope construction, similar to the one in Fig. 6 and also cut pixels with slopes α < −3. The lowest row shows histograms of the pixels in the spectral slope maps. Solid lines are simple histograms, dotted lines are synchrotron flux-weighted histograms. The grayed-out area indicates spectral slopes that are too flat for the standard DSA picture.
Current usage metrics show cumulative count of Article Views (full-text article views including HTML views, PDF and ePub downloads, according to the available data) and Abstracts Views on Vision4Press platform.
Data correspond to usage on the plateform after 2015. The current usage metrics is available 48-96 hours after online publication and is updated daily on week days.
Initial download of the metrics may take a while.