Fig. 6.
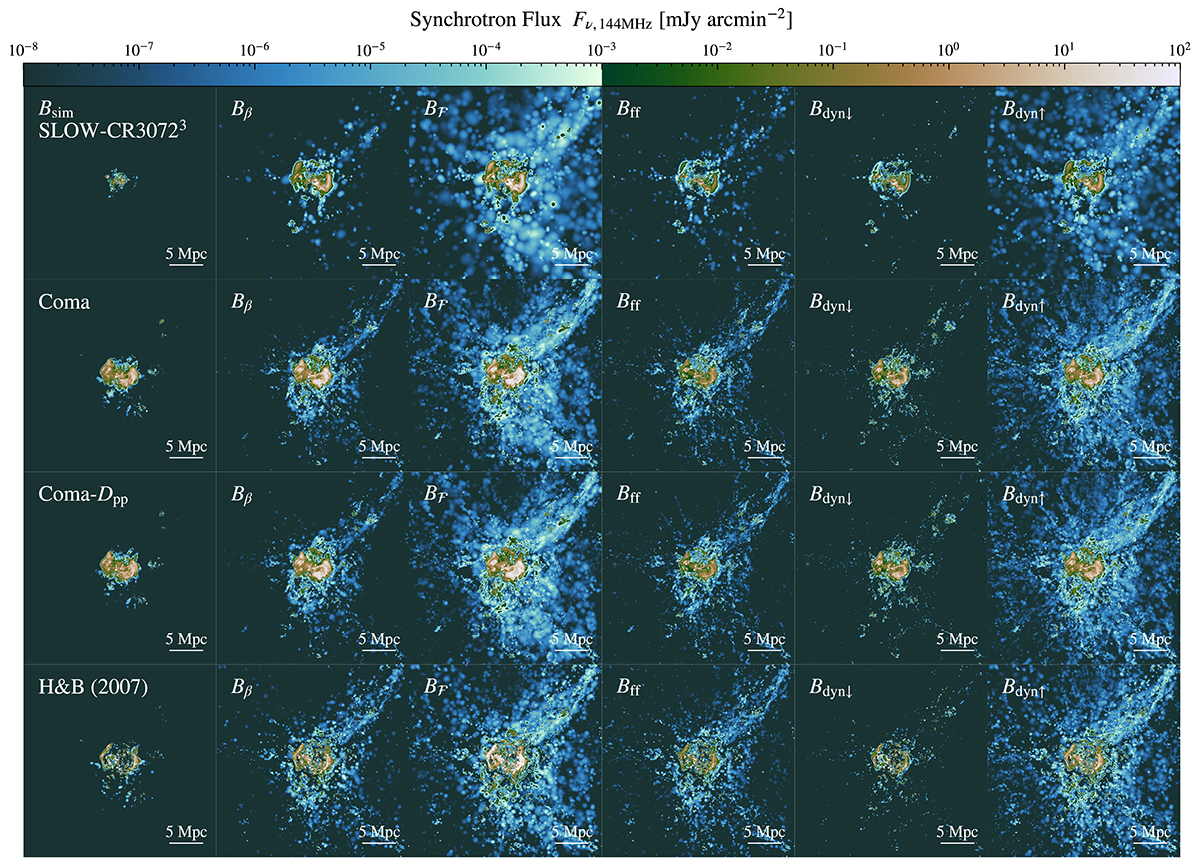
Download original image
Same cutout as in Fig. 4, but showing the synchrotron surface brightness at 144 MHz, assuming a LOFAR beam size of θ = 60″ × 60″ as in Bonafede et al. (2022). The color bar is split at 1 μJy beam−1, which is a factor two above the sensitivity limit in the stacking approach by Hoang et al. (2023). From top to bottom, we show the different simulation runs, and from left to right we vary the magnetic field models. The lowest row shows the result of painting on synchrotron emission with the Hoeft & Brüggen (2007) model in a post-processing approach. For this, we use the COMA simulation due to the better performance of the shock finder at this resolution, compared to SLOW-CR30723.
Current usage metrics show cumulative count of Article Views (full-text article views including HTML views, PDF and ePub downloads, according to the available data) and Abstracts Views on Vision4Press platform.
Data correspond to usage on the plateform after 2015. The current usage metrics is available 48-96 hours after online publication and is updated daily on week days.
Initial download of the metrics may take a while.