Open Access
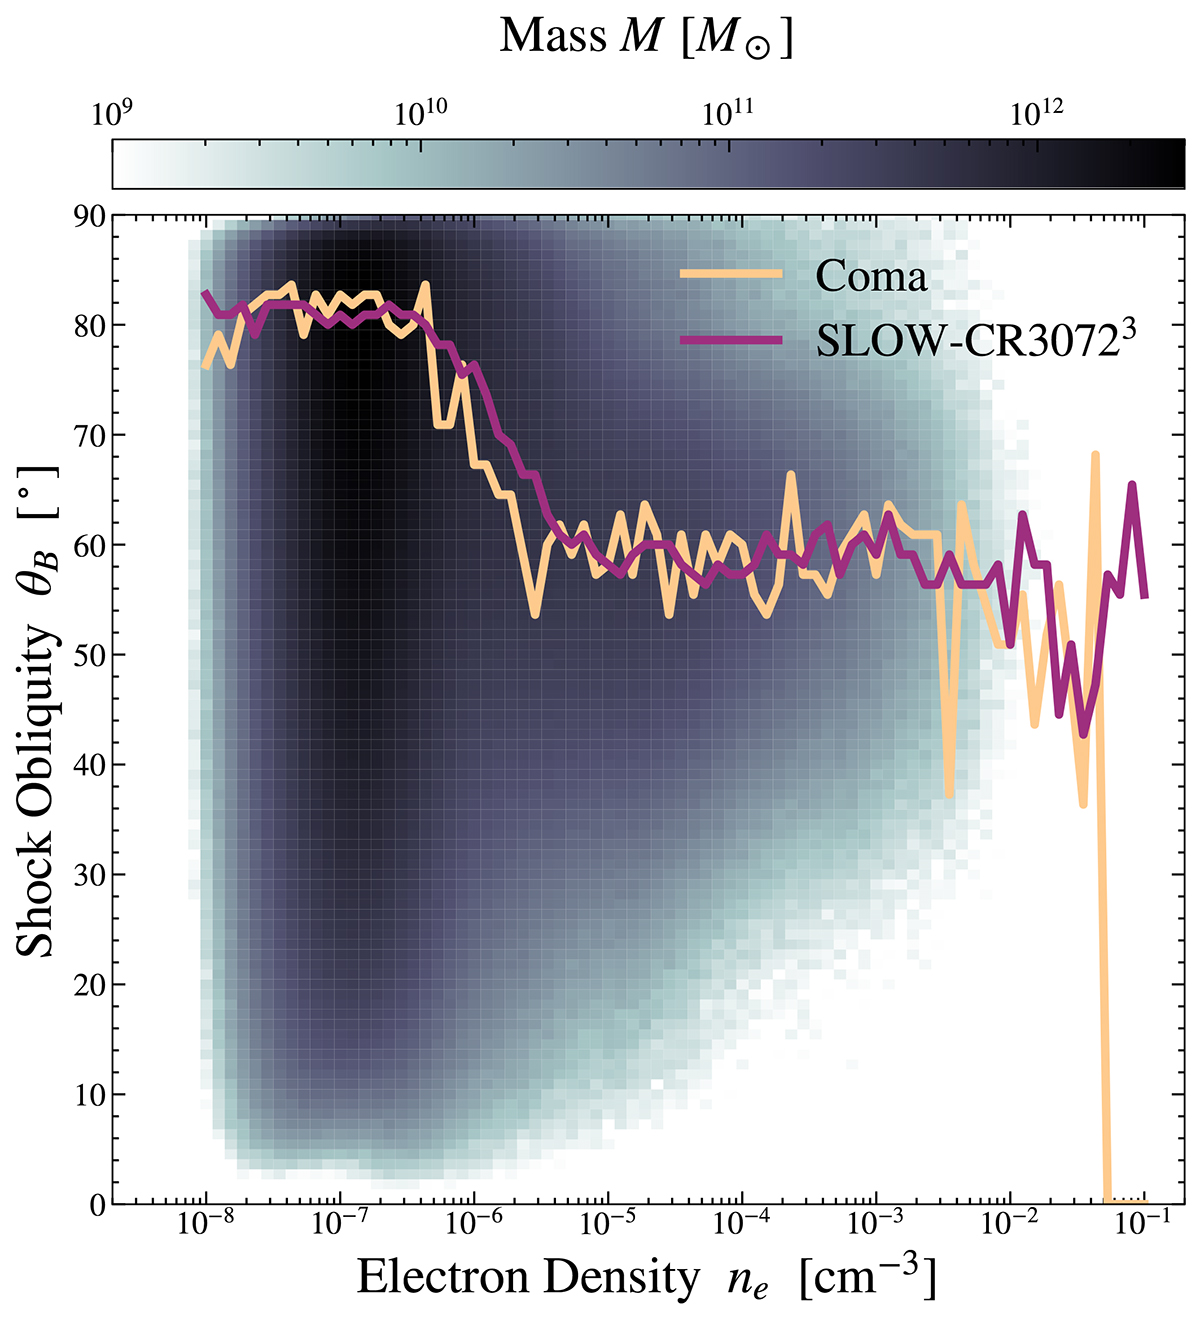
Fig. 13.
Download original image
Density – shock obliquity phase map. The colors indicate the 2D mass histogram for SLOW-CR30723, while the lines indicate the maximum of the histograms for SLOW-CR30723 and COMA as a function of density.
Current usage metrics show cumulative count of Article Views (full-text article views including HTML views, PDF and ePub downloads, according to the available data) and Abstracts Views on Vision4Press platform.
Data correspond to usage on the plateform after 2015. The current usage metrics is available 48-96 hours after online publication and is updated daily on week days.
Initial download of the metrics may take a while.