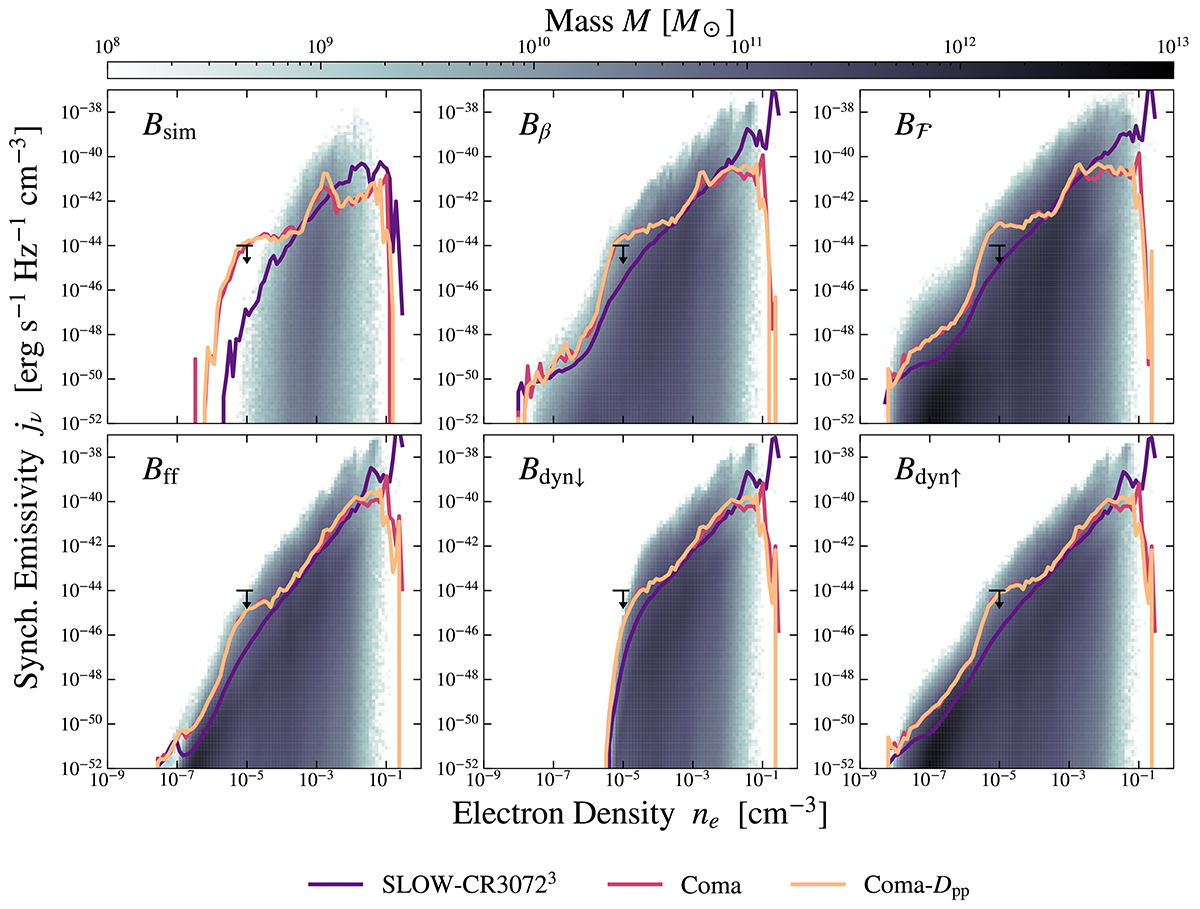
Fig. 11.
Download original image
Individual panels showing the phase-space diagrams in the density-synchrotron emissivity phase-space, containing all gas particles in the simulation. The background shows mass histograms per phase-space element from the original simulation output. The colored lines indicate the mean synchrotron emissivity per density interval for the cosmological box simulation and the zoom-in simulations with and without turbulent reacceleration. All emissivities are calculated at a frequency of ν = 144 MHz. The upper limit of the synchrotron emissivity is taken from Hoang et al. (2023).
Current usage metrics show cumulative count of Article Views (full-text article views including HTML views, PDF and ePub downloads, according to the available data) and Abstracts Views on Vision4Press platform.
Data correspond to usage on the plateform after 2015. The current usage metrics is available 48-96 hours after online publication and is updated daily on week days.
Initial download of the metrics may take a while.