Open Access
Fig. 10.
Download original image
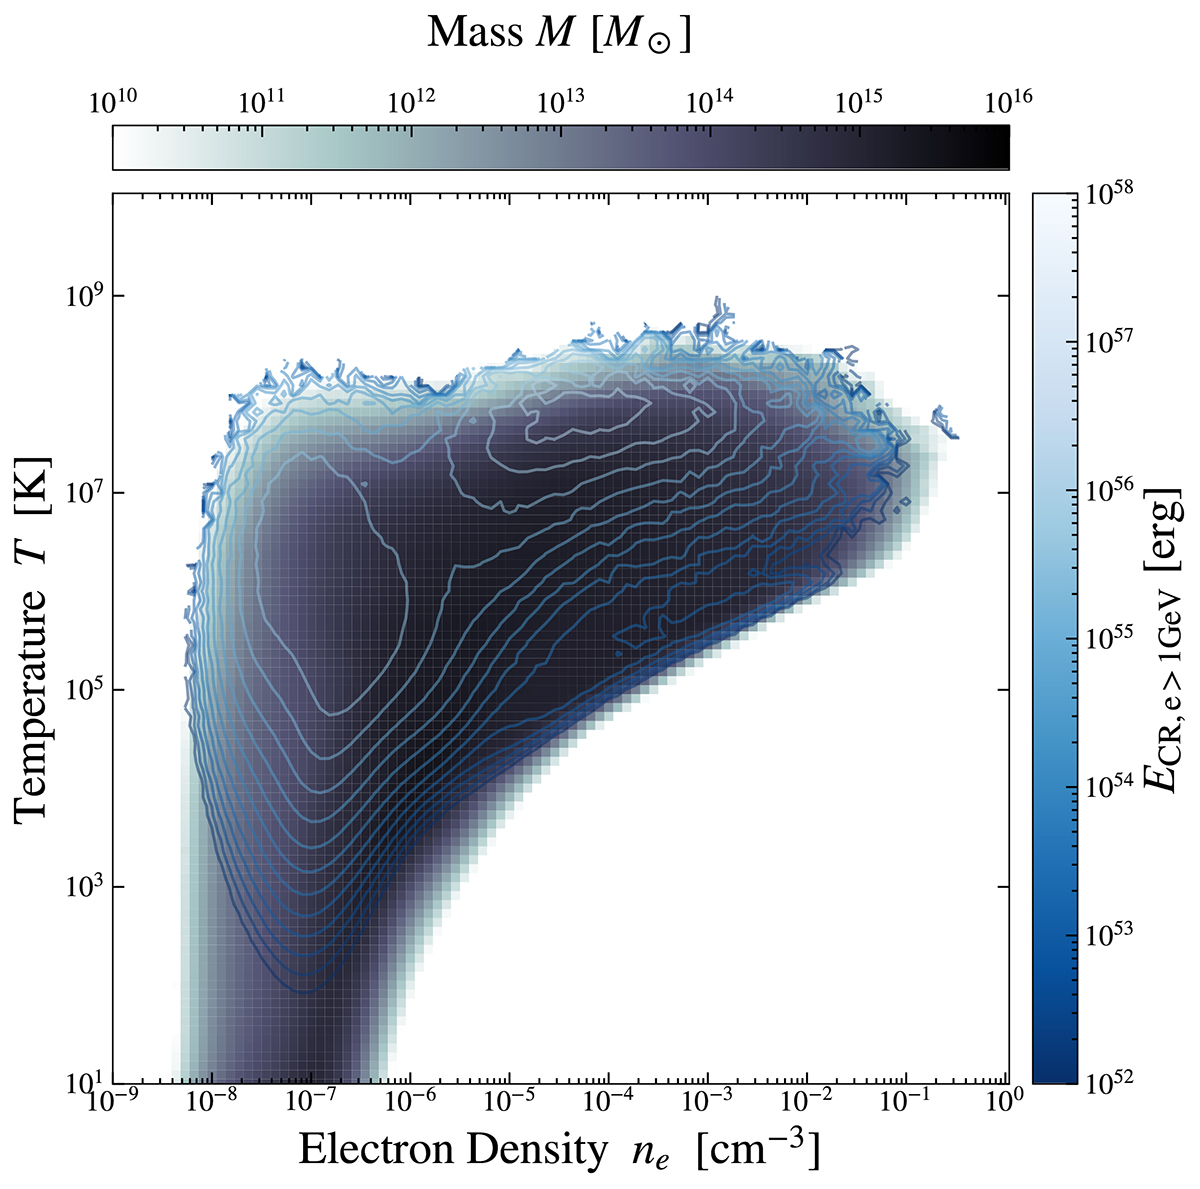
Density – temperature phase diagram of all gas particles in the simulation. The colored background shows the mass histogram in phase space. The contours show the CR electron energy of CRs with energies above 1 GeV contained per phase-space element.
Current usage metrics show cumulative count of Article Views (full-text article views including HTML views, PDF and ePub downloads, according to the available data) and Abstracts Views on Vision4Press platform.
Data correspond to usage on the plateform after 2015. The current usage metrics is available 48-96 hours after online publication and is updated daily on week days.
Initial download of the metrics may take a while.