Fig. 1.
Download original image
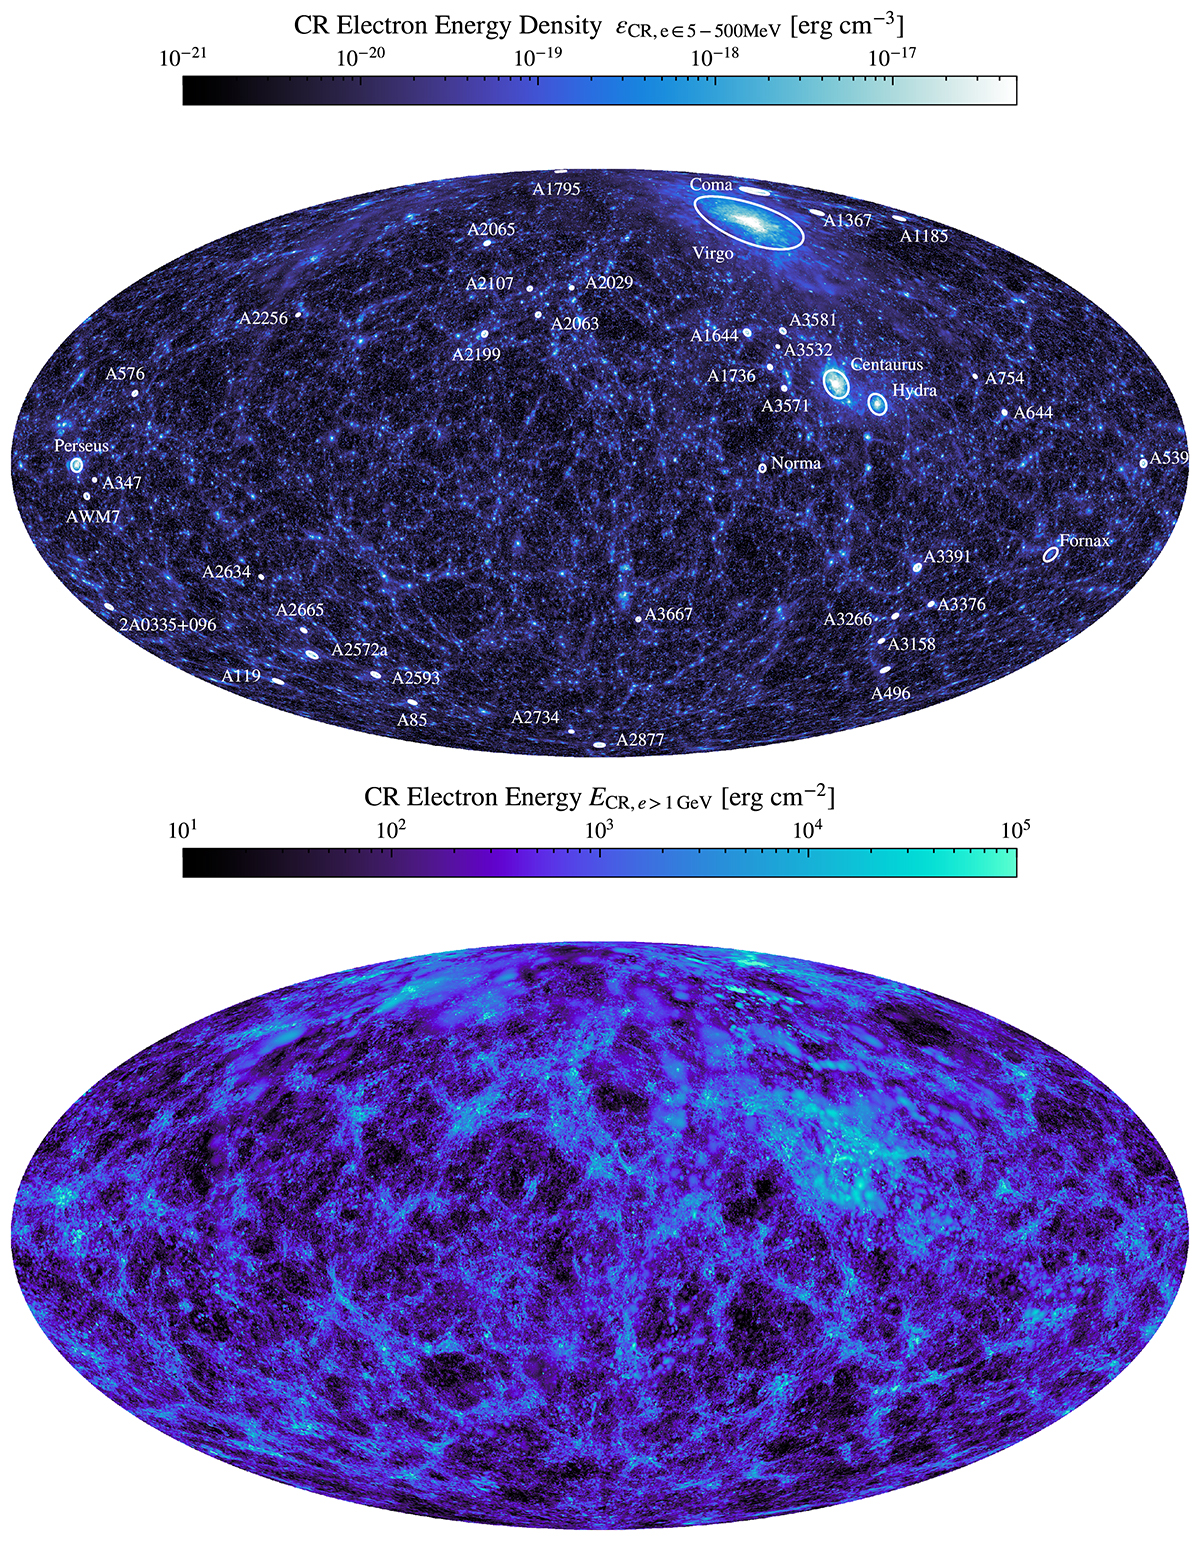
Full-sky projections of the CR electron component. Upper panel: Energy density of electrons in the range E ∈ [5 − 500] MeV as the mean along the line of sight in a radius range r = 5 − 300 Mpc. This traces the injected energy density of the CR electrons with the longest lifetimes. Circles indicate the projected rvir of the cross-identified clusters (see Hernández-Martínez et al. 2024). Lower panel: CR electrons with energies ECR, e > 1 GeV integrated along the line of sight in a radius range r = 5 − 300 Mpc. The short cooling times of these electrons lead to this map tracing recent injection events.
Current usage metrics show cumulative count of Article Views (full-text article views including HTML views, PDF and ePub downloads, according to the available data) and Abstracts Views on Vision4Press platform.
Data correspond to usage on the plateform after 2015. The current usage metrics is available 48-96 hours after online publication and is updated daily on week days.
Initial download of the metrics may take a while.