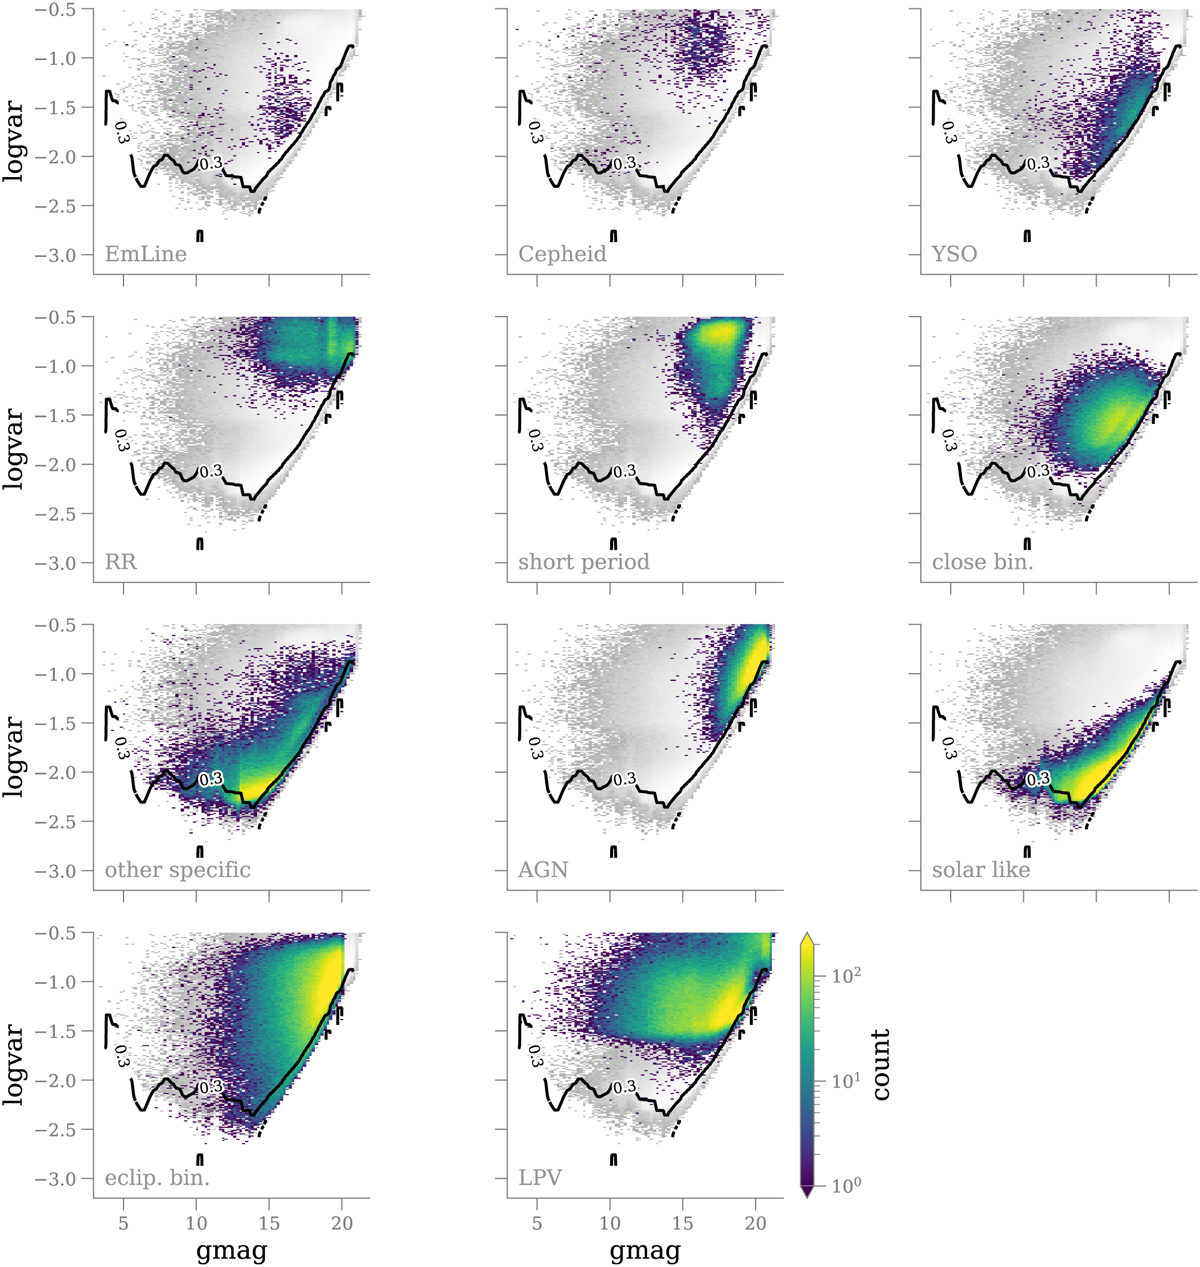
Fig. C.1
Download original image
Distribution of the main Gaia DR3 variable classes, as defined by Gavras et al. (2023), in the variability space of Figure 8 used to define Pvar. All panels show the distribution of the variables identified in Gaia DR3 (phot_variable_flaց = ’VARIABLE’) in gray and the density distribution of a given class of variables, as labeled in each panel. We only show classes with at least 5,000 identified sources and we overlay our Pvar = 0.3 threshold for comparison. The proposed cut effectively rejects the most obvious classes of variables.
Current usage metrics show cumulative count of Article Views (full-text article views including HTML views, PDF and ePub downloads, according to the available data) and Abstracts Views on Vision4Press platform.
Data correspond to usage on the plateform after 2015. The current usage metrics is available 48-96 hours after online publication and is updated daily on week days.
Initial download of the metrics may take a while.