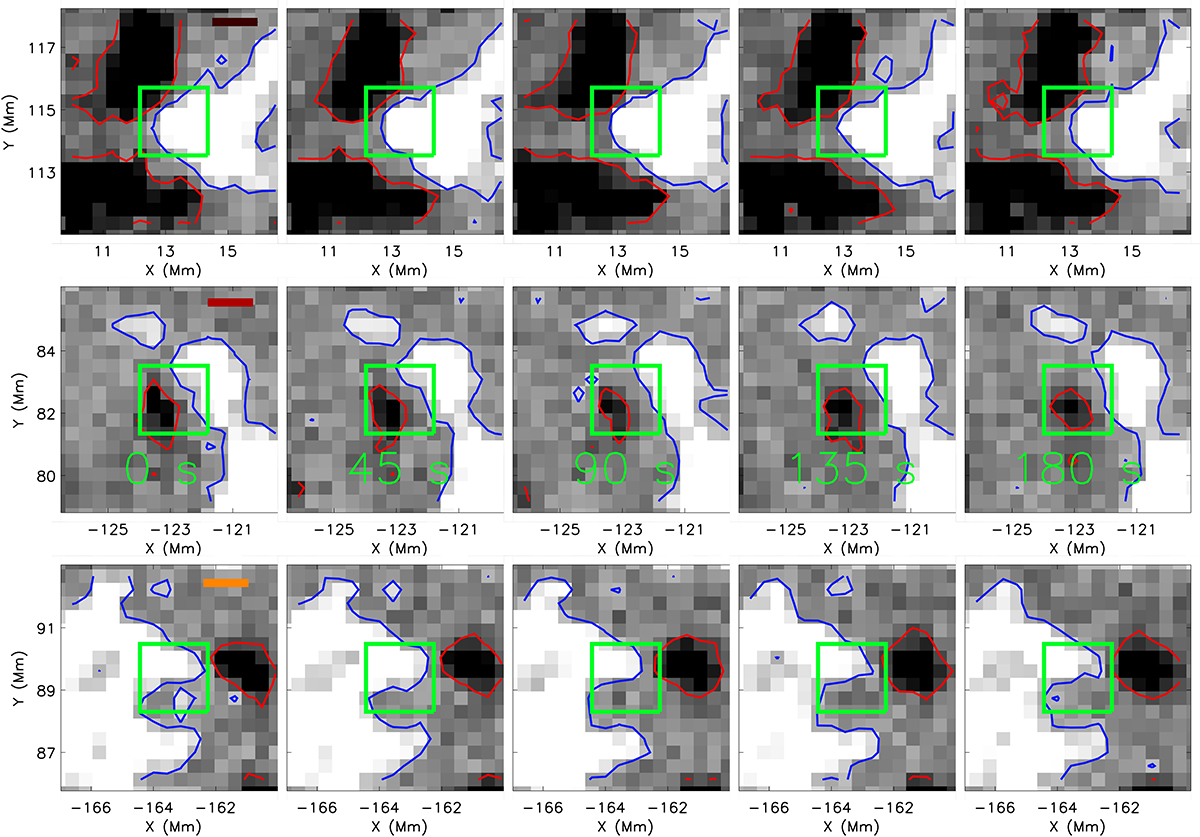
Fig. 6.

Download original image
Evolution of the SDO/HMI LoS magnetic field during the occurrence of the three strong bipolar cancelling EUV brightenings, plotted with the dashed lines in the left panel of Fig. 5. The over-laid blue and red contours outline the regions where positive and negative LoS magnetic field above an absolute strength of 20 G, respectively, is measured. The green boxes outline the FOV used to categorise the events and to construct the normalised flux plots. The time between columns is 45 s. Top row: Time series for the darkest line (corresponding to the region where numerous cancelling and emerging EUV brightenings were detected). Middle row: Time series for the red line. Bottom row: Time series for the orange line. Short lines are included in the first row to indicate this more clearly on the figure.
Current usage metrics show cumulative count of Article Views (full-text article views including HTML views, PDF and ePub downloads, according to the available data) and Abstracts Views on Vision4Press platform.
Data correspond to usage on the plateform after 2015. The current usage metrics is available 48-96 hours after online publication and is updated daily on week days.
Initial download of the metrics may take a while.


