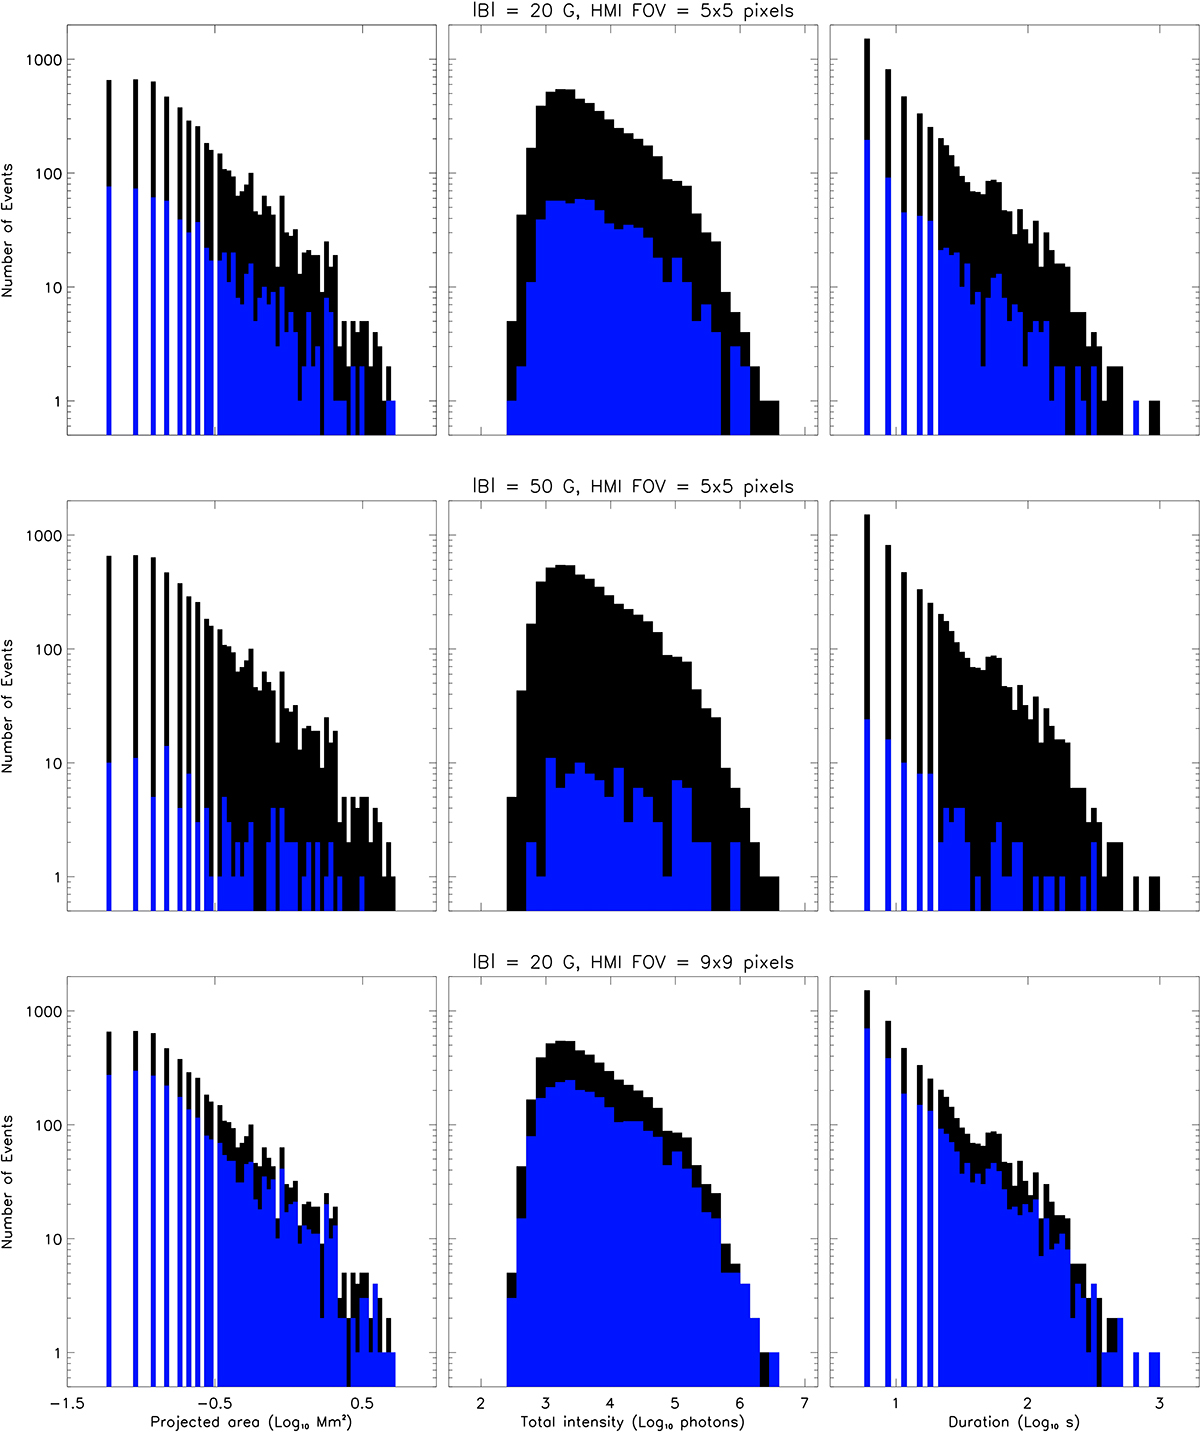
Fig. 4.
Download original image
Same plots as those given in the top row of Fig. 2, but with the distributions of strong bipolar EUV brightenings overlaid (blue bars) for three different m and Bth pairings. Top row: Statistical distributions for our base pairing of m = 5 and Bth = 20 G. Middle row: Statistical distributions for our strictest pairing of m = 5 and Bth = 50 G. Bottom row: Statistical distributions for our loosest pairing of m = 9 and Bth = 20 G.
Current usage metrics show cumulative count of Article Views (full-text article views including HTML views, PDF and ePub downloads, according to the available data) and Abstracts Views on Vision4Press platform.
Data correspond to usage on the plateform after 2015. The current usage metrics is available 48-96 hours after online publication and is updated daily on week days.
Initial download of the metrics may take a while.