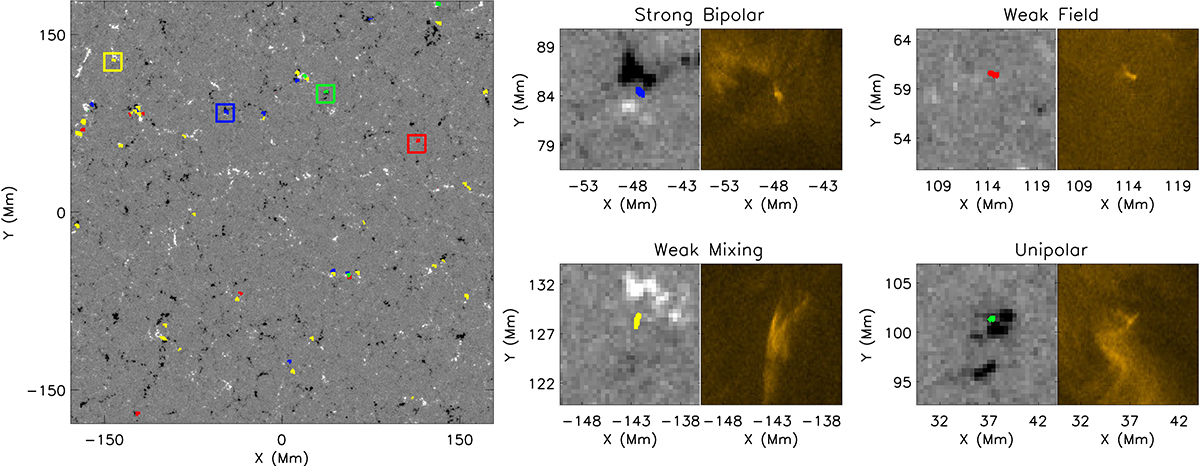
Fig. 3.
Download original image
Relationship between EUV brightenings and the LoS magnetic field in the quiet-Sun. Left panel: Background image plots a LoS magnetic field map measured by SDO/HMI at around 00:29:42 UT, saturated at ±100 G. The over-laid contours outline EUV brightenings with the different colours representing different LoS magnetic field configurations in the photosphere, measured within a 5 × 5 pixel2 SDO/HMI FOV centred on the middle of the EUV brightening. Blue contours indicate EUV brightenings where the strong bipolar field (both polarities with maxima above |20| G) is measured co-spatially. Red contours indicate EUV brightenings where only weak field (less than |20| G) is measured co-spatially. Green contours indicate EUV brightenings where unipolar (e.g. only positive or only negative polarities measured, with the present polarity having a maximum field strength above |20| G) field is measured co-spatially. The yellow contours indicate EUV brightenings where one strong polarity (greater than |20| G) and one weak polarity (less than |20| G) are measured co-spatially. The four coloured boxes outline the representative EUV brightenings that are plotted in the right hand panels. Right panels: SDO/HMI LoS magnetic field maps (left panels) and HRIEUV 17.4 nm intensity maps (right panels) of EUV brightenings (outlined by coloured contours), where strong bipolar (top left), weak field (top right), weak mixing (bottom left), and unipolar (bottom right) LoS magnetic field is measured co-spatially. A movie associated with this figure is available online.
Current usage metrics show cumulative count of Article Views (full-text article views including HTML views, PDF and ePub downloads, according to the available data) and Abstracts Views on Vision4Press platform.
Data correspond to usage on the plateform after 2015. The current usage metrics is available 48-96 hours after online publication and is updated daily on week days.
Initial download of the metrics may take a while.