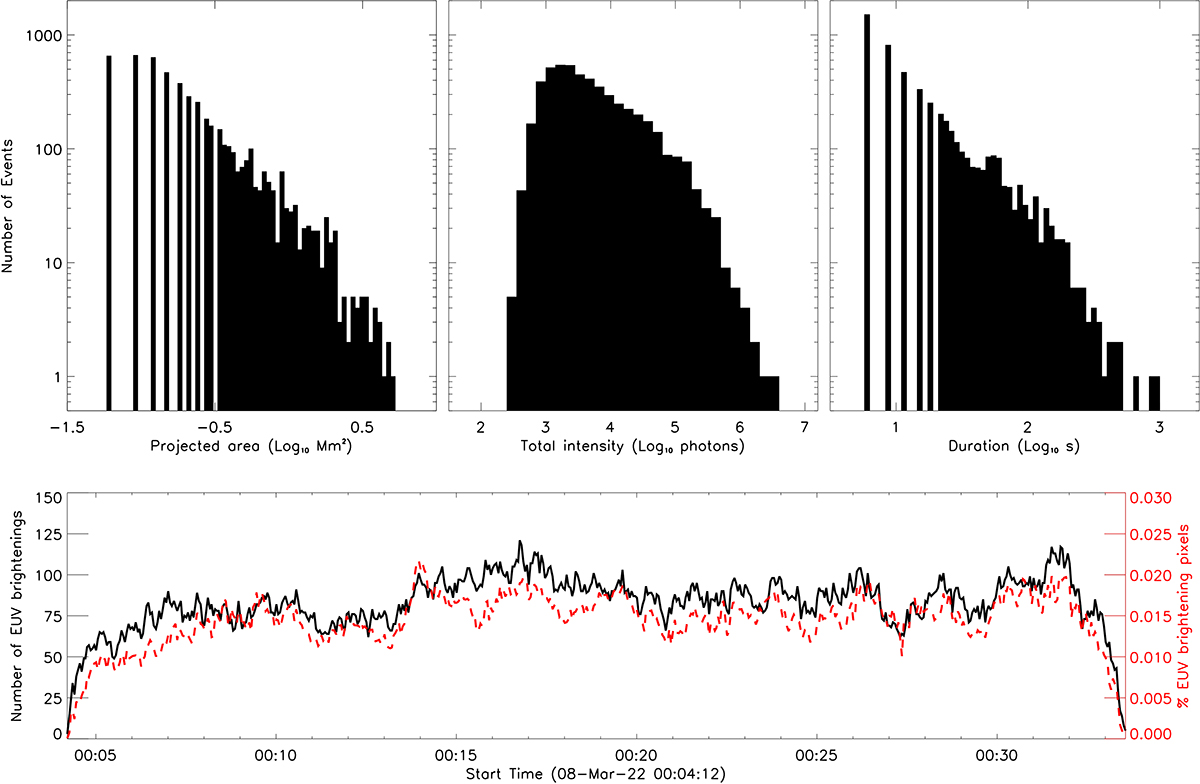
Fig. 2.
Download original image
Statistical properties of the 5064 EUV brightenings that match the criteria outlined in Sect. 2.2 identified within this dataset by the automated detection algorithm. Top left panel: Histogram plotting the peak projected area of each EUV brightening (log-scaled along both the x- and y-axes) binned in the log-scale. Top middle panel: Histogram plotting the total intensity of each EUV brightening summed across space and time (log-scaled along the x- and y-axes) binned in the log-scale. Top right panel: A histogram plotting the duration of each EUV brightening (log-scaled along both the x- and y-axes) binned in the log-scale. Bottom panel: Time series plotting the number of EUV brightenings (black solid line) and the percentage of pixels found to be within EUV brightenings (red dashed line) throughout this dataset. We note that both of these metrics tend to zero at each end of the time series as we remove EUV brightenings found in the first and last frames from our sample (which reduces the number of events detected close to either end of the time series).
Current usage metrics show cumulative count of Article Views (full-text article views including HTML views, PDF and ePub downloads, according to the available data) and Abstracts Views on Vision4Press platform.
Data correspond to usage on the plateform after 2015. The current usage metrics is available 48-96 hours after online publication and is updated daily on week days.
Initial download of the metrics may take a while.