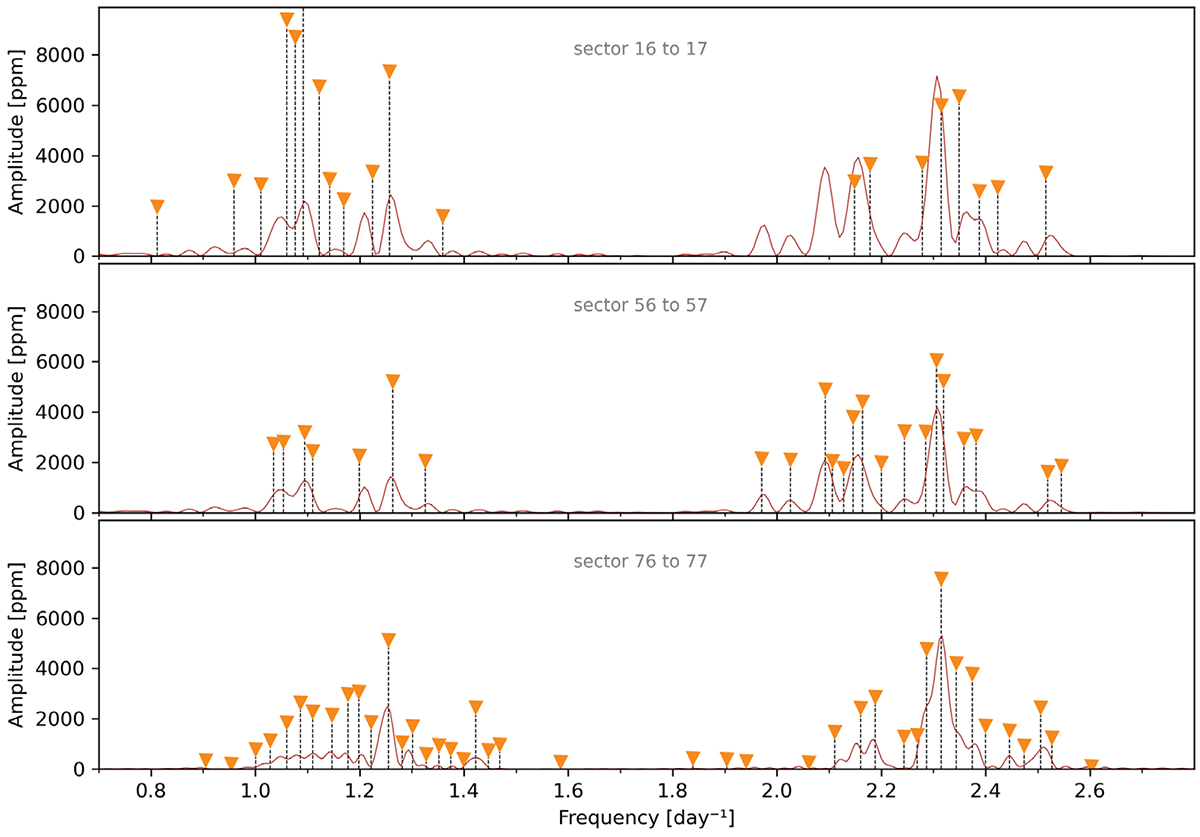
Fig. A.1.
Download original image
Frequency spectrum for each pair of TESS sectors of HD 212044. Orange triangles and dashed lines indicate the frequencies detected using the iterative pre-whitening method, with S/N ≥ 5. The red line represents a simple Lomb-Scargle periodogram. Two distinct groups of frequencies are evident: a first one primarily between 1.0 and 1.4 d−1, and a second one between 2.0 and 2.5 d−1. Many frequencies remain consistent across the three observation segments. Within the first group, we identify 1.26 d−1 as the main frequency, which is strong and stable over the three and a half years spanned by the observations. In contrast, the frequency at 1.09 d−1 is very strong during the first cycle, with an amplitude of 11,300 ppm (beyond the scale of the figure), but its amplitude reduces by more than half in subsequent cycles. We propose that this frequency corresponds to the Stefl frequency (Stefl et al. 1998; Baade et al. 2016), a transient exophotospheric frequency that is enhanced during outbursts and typically appears ∼10% below the main pulsation frequency. The dominant pulsation frequency in the second group was detected at 2.35 d−1. The first harmonic of the Stefl frequency is visible at 2.17 d−1.
Current usage metrics show cumulative count of Article Views (full-text article views including HTML views, PDF and ePub downloads, according to the available data) and Abstracts Views on Vision4Press platform.
Data correspond to usage on the plateform after 2015. The current usage metrics is available 48-96 hours after online publication and is updated daily on week days.
Initial download of the metrics may take a while.