Fig. 1.
Download original image
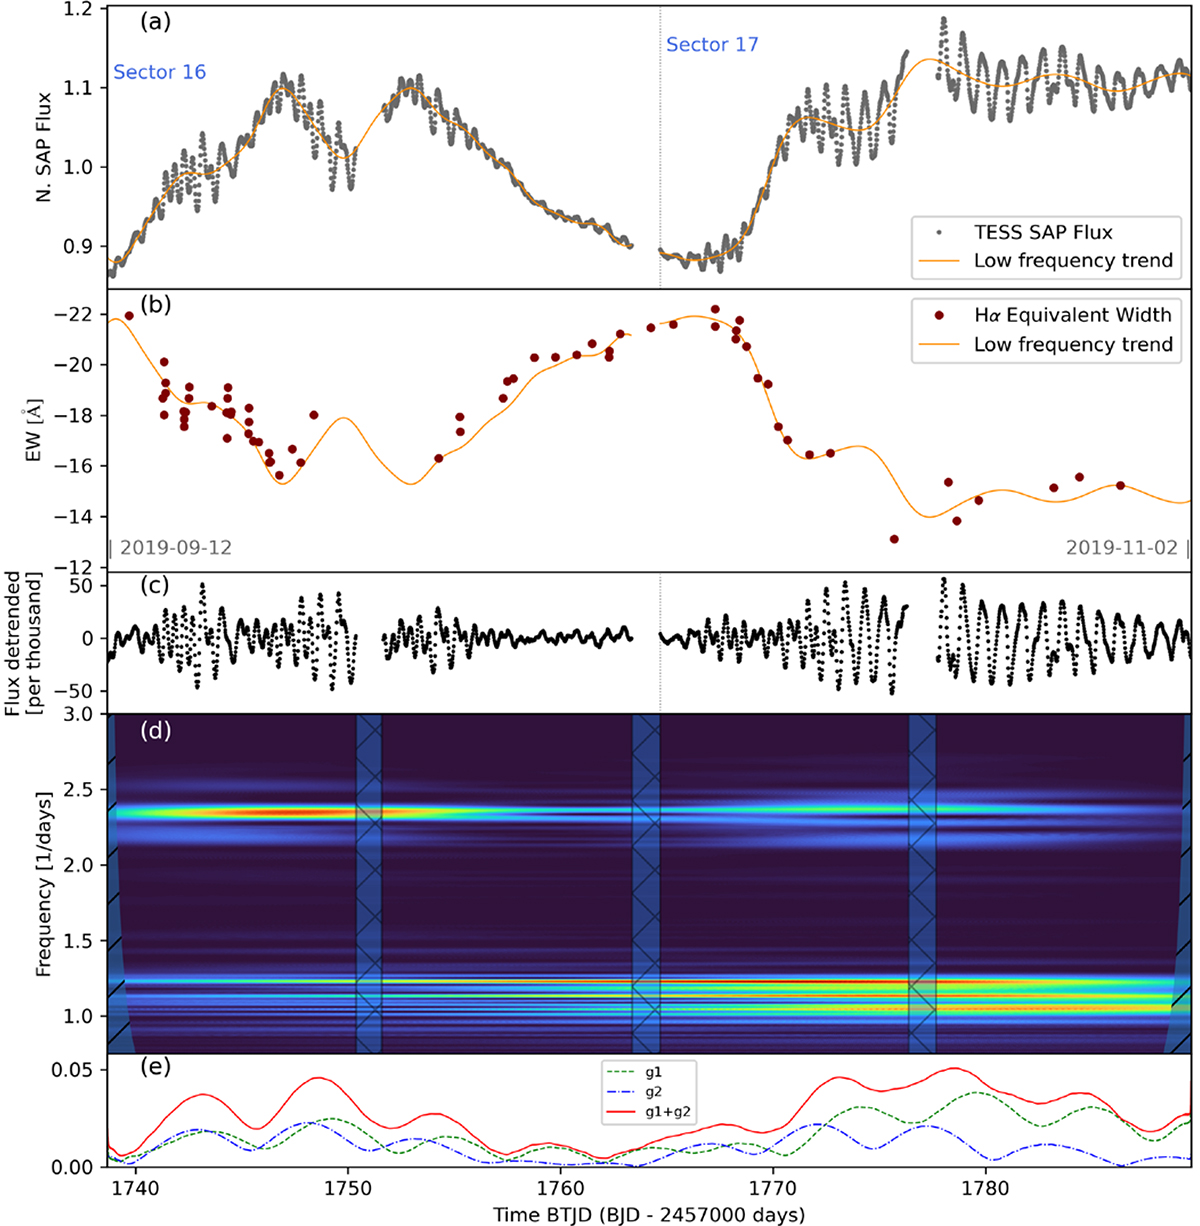
Variability of HD 212044 during TESS sectors 16 and 17. (a) Normalized TESS SAP flux, with the orange line indicating the low-frequency trend. (b) Hα EW measurements (red points). The orange line represents the low-frequency trend line from panel (a), mirrored to match the EW variations. (c) Detrended flux, highlighting frequency beatings (see Sect. 4). (d) Wavelet analysis of the TESS signal, showing the frequency content over time. (e) Amplitude modulation corresponding to the beatings and intensity variations in the five frequencies with the highest amplitudes of the first (in green) and second (in blue) frequency groups. The red curve represents the vector sum combined effect of the two groups. Abscissas are in BTJD = BJD – 2457000 (details in Sect. 4).
Current usage metrics show cumulative count of Article Views (full-text article views including HTML views, PDF and ePub downloads, according to the available data) and Abstracts Views on Vision4Press platform.
Data correspond to usage on the plateform after 2015. The current usage metrics is available 48-96 hours after online publication and is updated daily on week days.
Initial download of the metrics may take a while.