Fig. 3
Download original image
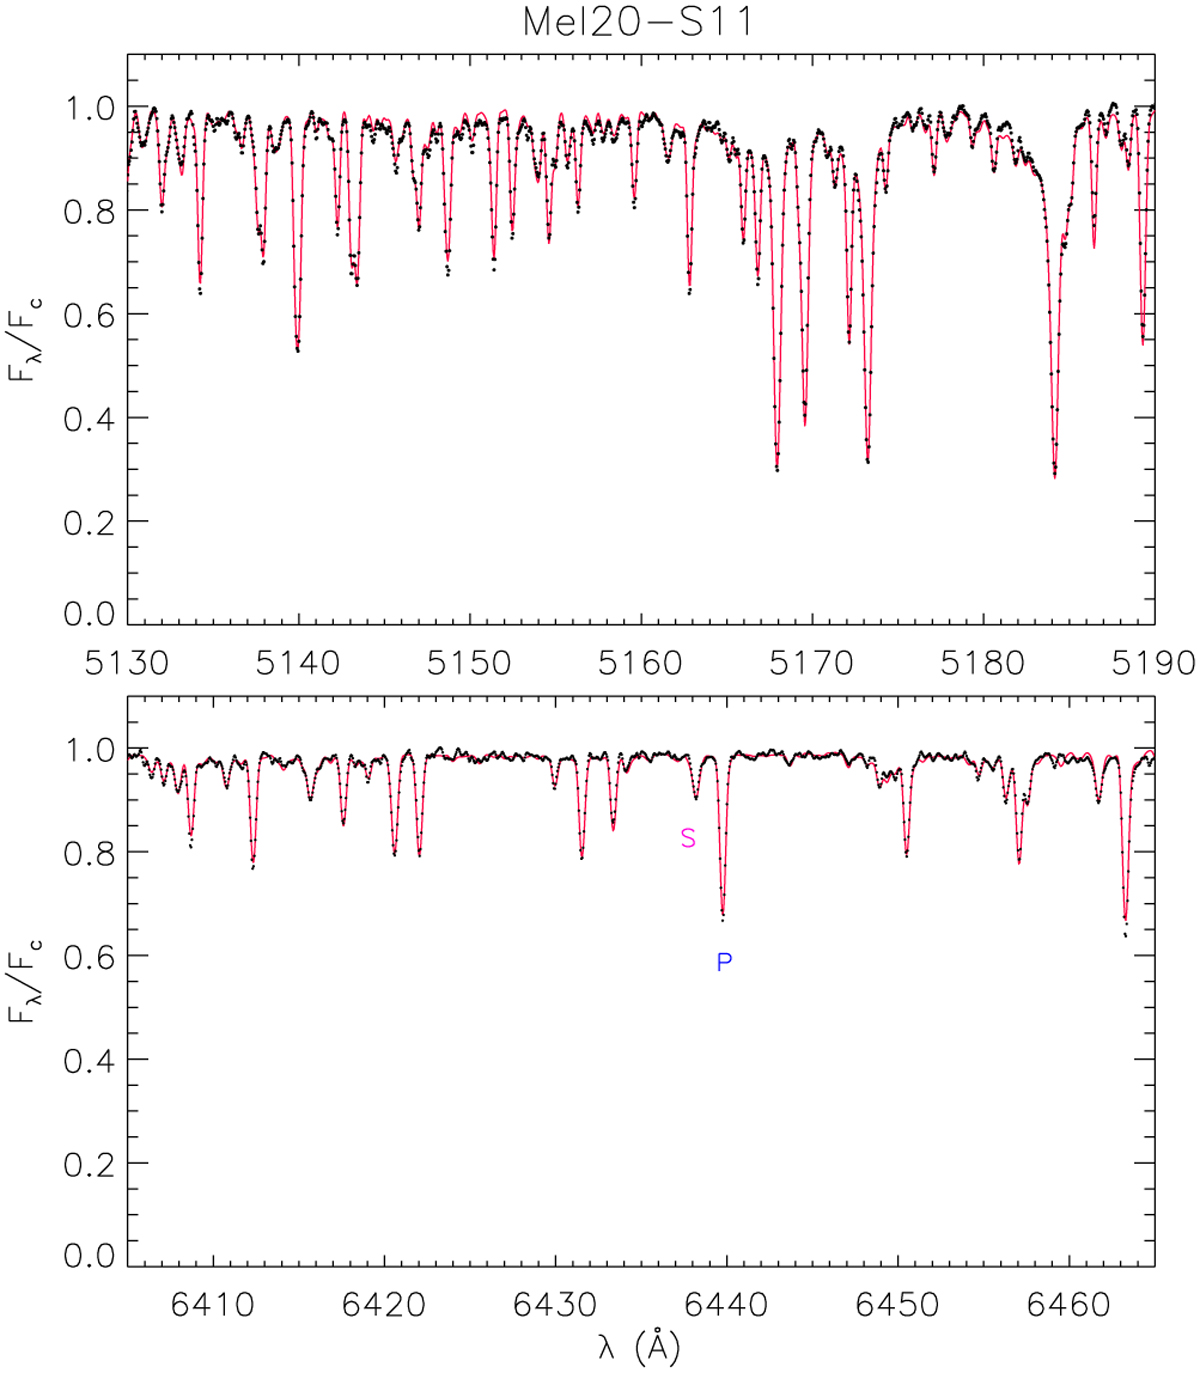
Observed HARPS-N spectrum of the SB2 system Mel20-S11 (black dots) around the Mg I b lines (λ 5160 Å, upper panel) and around λ 6440 Å (lower panel). In each panel the synthetic spectrum, which is the weighted sum of two standard star spectra mimicking the primary and secondary component of Mel20-S115, is overplotted with a full red line.
Current usage metrics show cumulative count of Article Views (full-text article views including HTML views, PDF and ePub downloads, according to the available data) and Abstracts Views on Vision4Press platform.
Data correspond to usage on the plateform after 2015. The current usage metrics is available 48-96 hours after online publication and is updated daily on week days.
Initial download of the metrics may take a while.