Open Access
Fig. 2.
Download original image
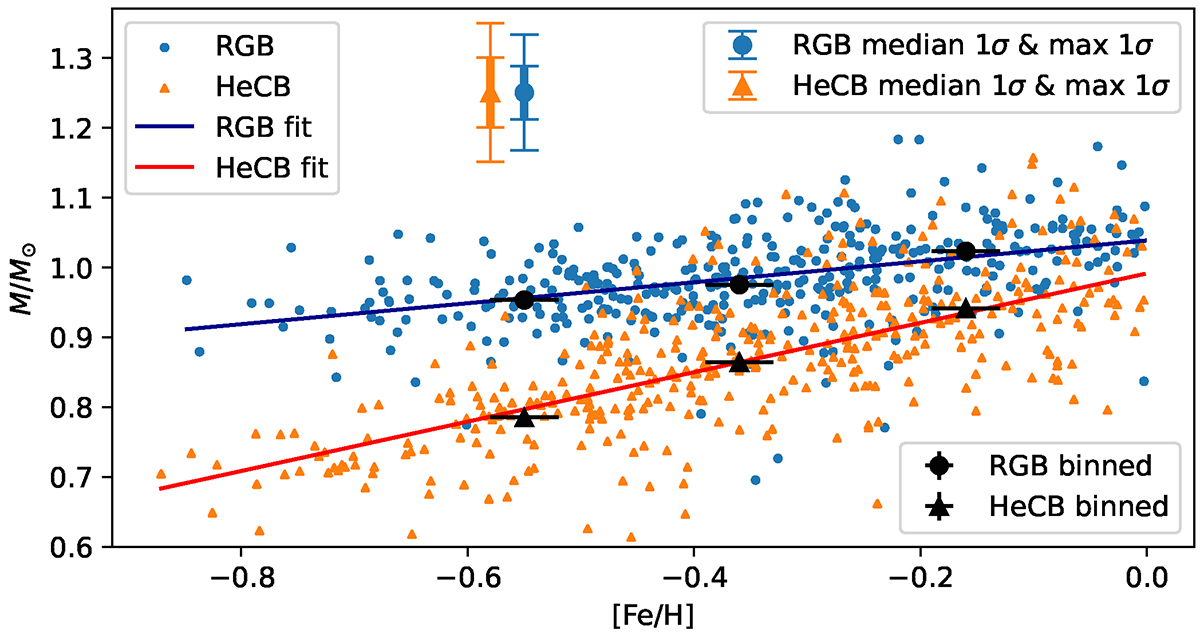
Mass vs [Fe/H] for RGB and HeCB Kepler giants. Black binned data points correspond to the bins in Fig. 1. The lines represent linear fits to rolling medians. The blue and orange double error bars represent the median and maximum 1σ mass uncertainty of the RGB and HeCB stars, respectively.
Current usage metrics show cumulative count of Article Views (full-text article views including HTML views, PDF and ePub downloads, according to the available data) and Abstracts Views on Vision4Press platform.
Data correspond to usage on the plateform after 2015. The current usage metrics is available 48-96 hours after online publication and is updated daily on week days.
Initial download of the metrics may take a while.