Fig. 10
Download original image
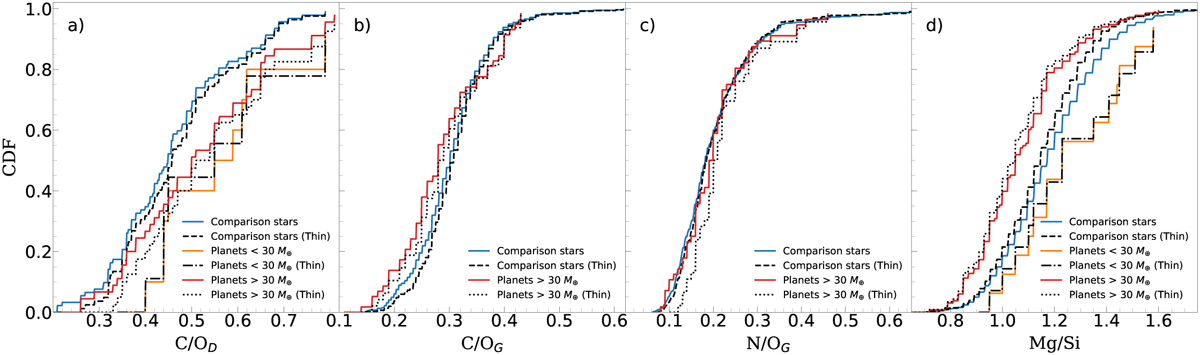
Cumulative distribution functions (CDFs) of C/O, N/O, and Mg/Si. In panel a: cumulative C/OD distributions for dwarf stars. Solid orange and red lines represent low-mass (Mp < 30 M⊕) and high-mass planet (Mp > 30 M⊕) hosts, while the solid blue line displays the comparison stars. Black lines represent the same as coloured, but only taking the stars with thin-disc kinematics. Panels b, c: cumulative C/OG; N/OG distributions for giant stars. Panel d: cumulative Mg/Si distributions for all stars with planetary companions and the comparison sample.
Current usage metrics show cumulative count of Article Views (full-text article views including HTML views, PDF and ePub downloads, according to the available data) and Abstracts Views on Vision4Press platform.
Data correspond to usage on the plateform after 2015. The current usage metrics is available 48-96 hours after online publication and is updated daily on week days.
Initial download of the metrics may take a while.