Fig. 1
Download original image
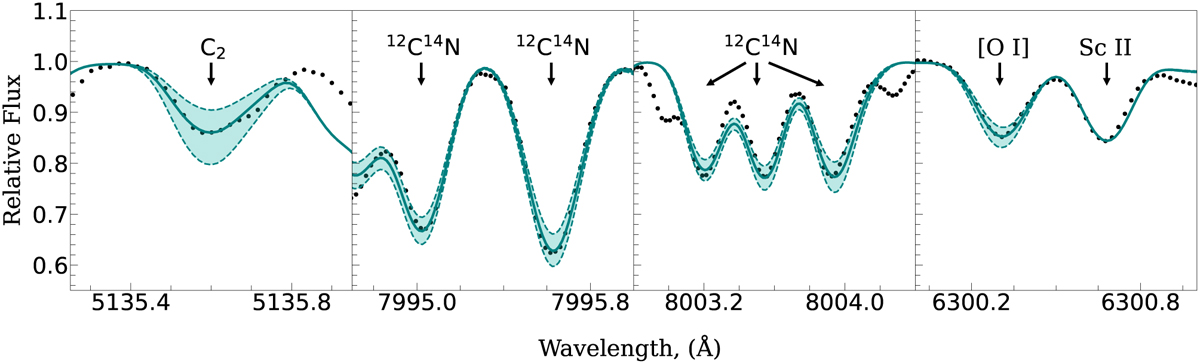
Example of spectral synthesis method showcasing the fitting of prominent spectral features including molecular carbon (C2) band head located at 5135 Å, molecular CN bands at 7995 and 8003 Å, alongside the atomic forbidden oxygen line [O I] at 6300 Å. The observed spectra are represented by black dots, while the solid green lines denote the optimal fit of synthetic spectra to the observed data along with variations of ±0.10 dex from the optimal fitted abundance.
Current usage metrics show cumulative count of Article Views (full-text article views including HTML views, PDF and ePub downloads, according to the available data) and Abstracts Views on Vision4Press platform.
Data correspond to usage on the plateform after 2015. The current usage metrics is available 48-96 hours after online publication and is updated daily on week days.
Initial download of the metrics may take a while.