Open Access
Fig. 13
Download original image
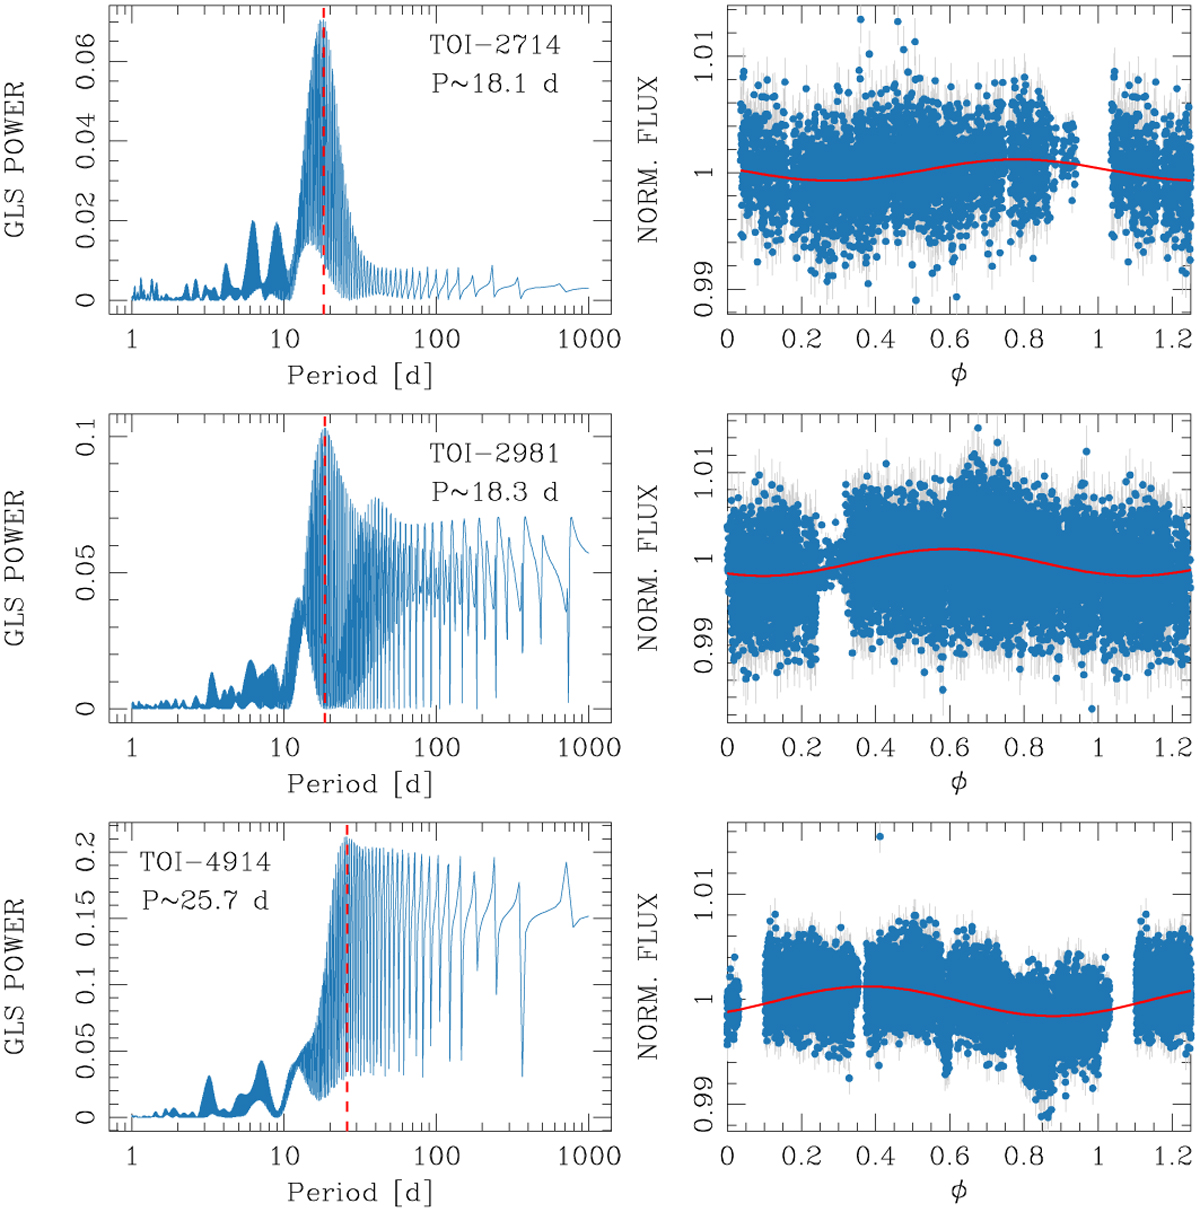
GLS periodograms and TESS phased light curves. The left panels show the GLS periodograms extracted from the photometric time series of TOI-2714 (top panel), TOI-2981 (middle panel), and TOI-4914 (bottom panel). The right panels show the phased light curves adopting the period corresponding to the peak of the periodogram.
Current usage metrics show cumulative count of Article Views (full-text article views including HTML views, PDF and ePub downloads, according to the available data) and Abstracts Views on Vision4Press platform.
Data correspond to usage on the plateform after 2015. The current usage metrics is available 48-96 hours after online publication and is updated daily on week days.
Initial download of the metrics may take a while.