Fig. 7.
Download original image
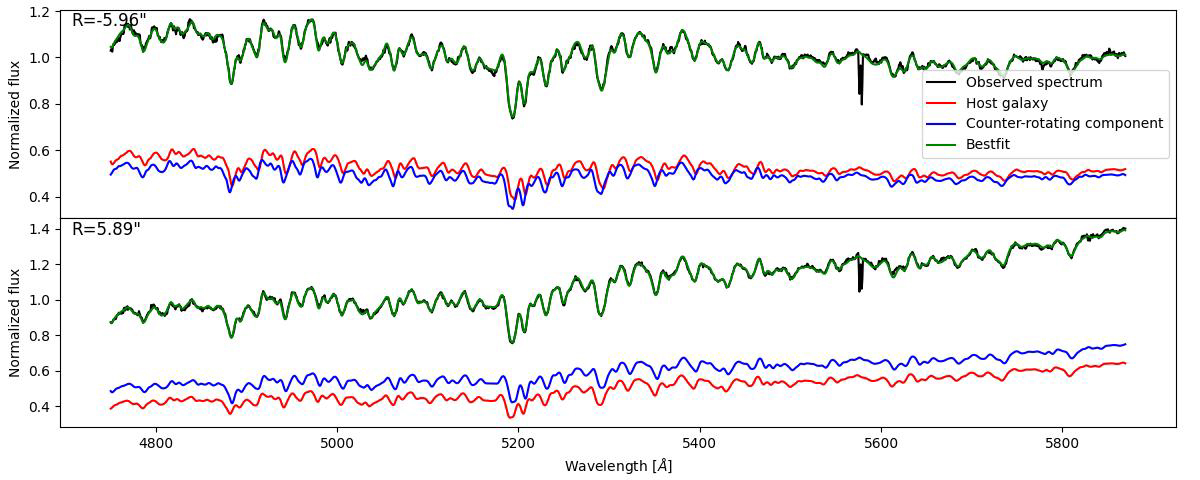
Spectral decomposition of galaxy spectrum at ![]() (upper panel) and
(upper panel) and ![]() (lower panel), where the contribution of the counter-rotating component is maximum. The observed spectrum (in the observer-frame, black line) is modeled by the sum (green line) of the contributions of two stellar components, corresponding to the counter-rotating stellar ring (blue line) and host galaxy (red line). The observed spectrum is normalized at its median value. No emission lines are visible in the galaxy spectrum across the entire slit. The artifact at 5577 Å is due to over-subtraction of the O I sky emission line at 5577 Å.
(lower panel), where the contribution of the counter-rotating component is maximum. The observed spectrum (in the observer-frame, black line) is modeled by the sum (green line) of the contributions of two stellar components, corresponding to the counter-rotating stellar ring (blue line) and host galaxy (red line). The observed spectrum is normalized at its median value. No emission lines are visible in the galaxy spectrum across the entire slit. The artifact at 5577 Å is due to over-subtraction of the O I sky emission line at 5577 Å.
Current usage metrics show cumulative count of Article Views (full-text article views including HTML views, PDF and ePub downloads, according to the available data) and Abstracts Views on Vision4Press platform.
Data correspond to usage on the plateform after 2015. The current usage metrics is available 48-96 hours after online publication and is updated daily on week days.
Initial download of the metrics may take a while.