Fig. 3.
Download original image
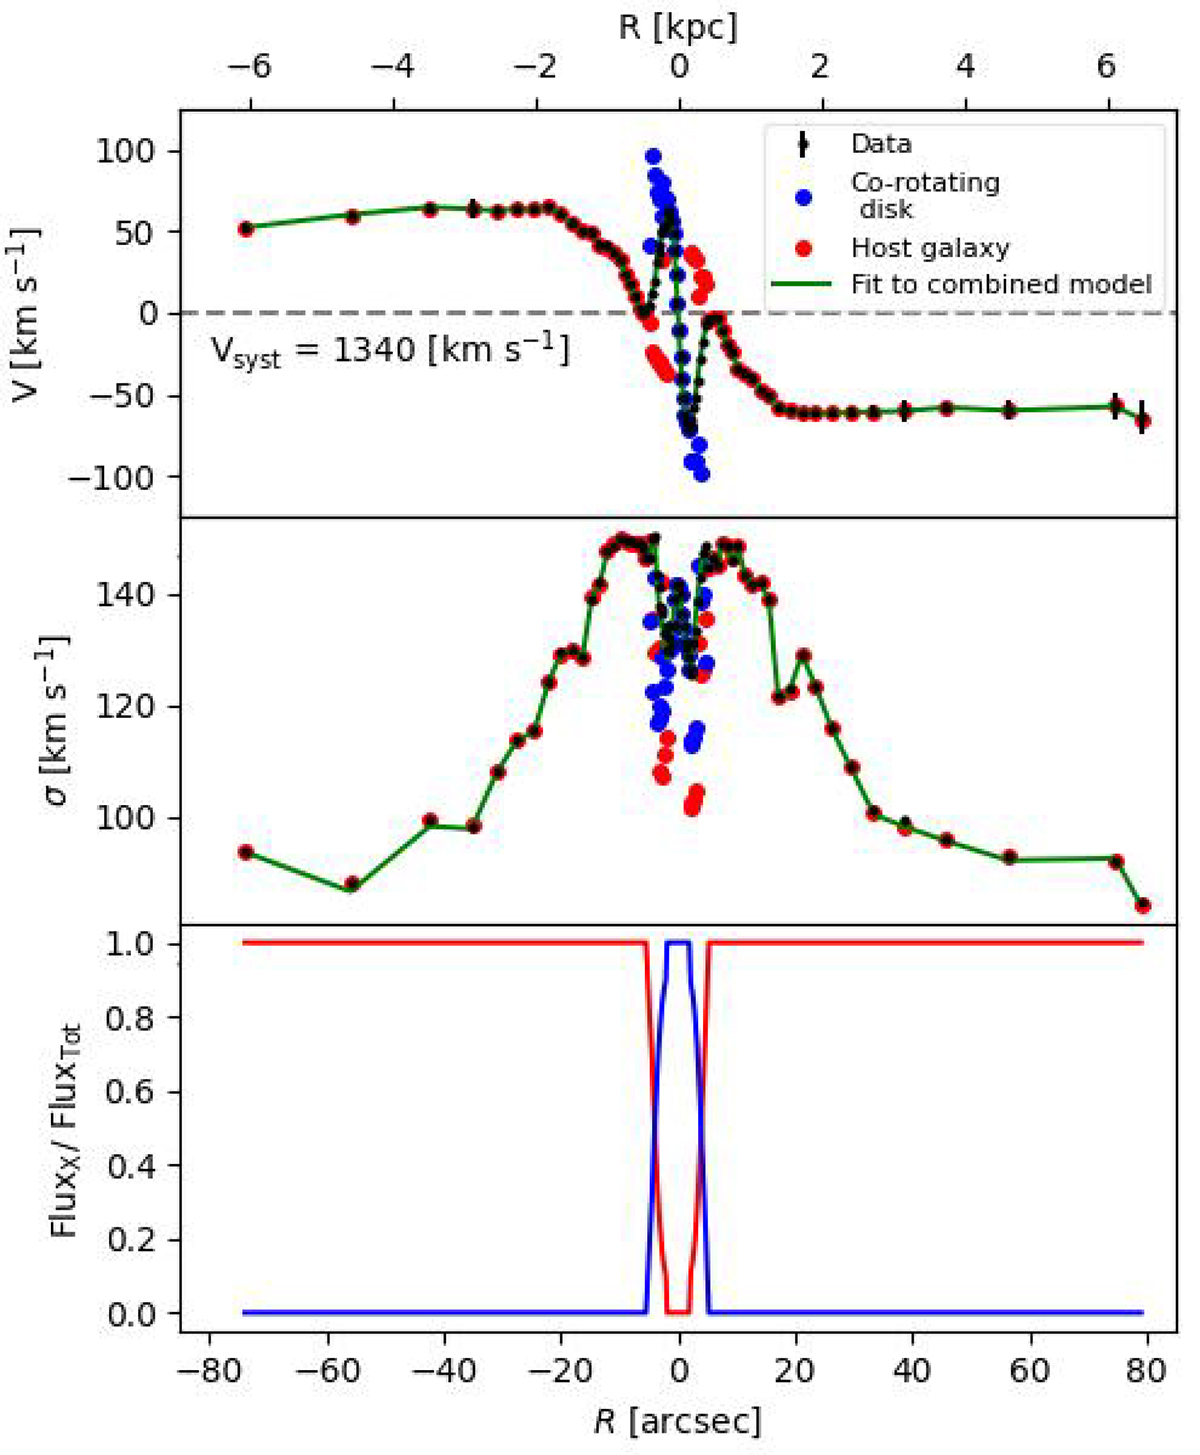
Best-fitting model of a co-rotating stellar disk. From top to bottom: Radial profiles of line-of-sight velocity, velocity dispersion, and flux ratio of each component with respect to total. The black circles correspond to data, blue circles to the co-rotating disk, red circles to the host galaxy, and the solid green line to the single-component fit of the best-fitting model obtained by combining the best-fitting spectra of the two components. Blue and red lines shows the fraction of total flux for the co-rotating disk and host galaxy, respectively. The best fit unveils the presence of counter-rotating stars, despite the starting guesses derived from the best-fitting toy model representing two co-rotating systems.
Current usage metrics show cumulative count of Article Views (full-text article views including HTML views, PDF and ePub downloads, according to the available data) and Abstracts Views on Vision4Press platform.
Data correspond to usage on the plateform after 2015. The current usage metrics is available 48-96 hours after online publication and is updated daily on week days.
Initial download of the metrics may take a while.