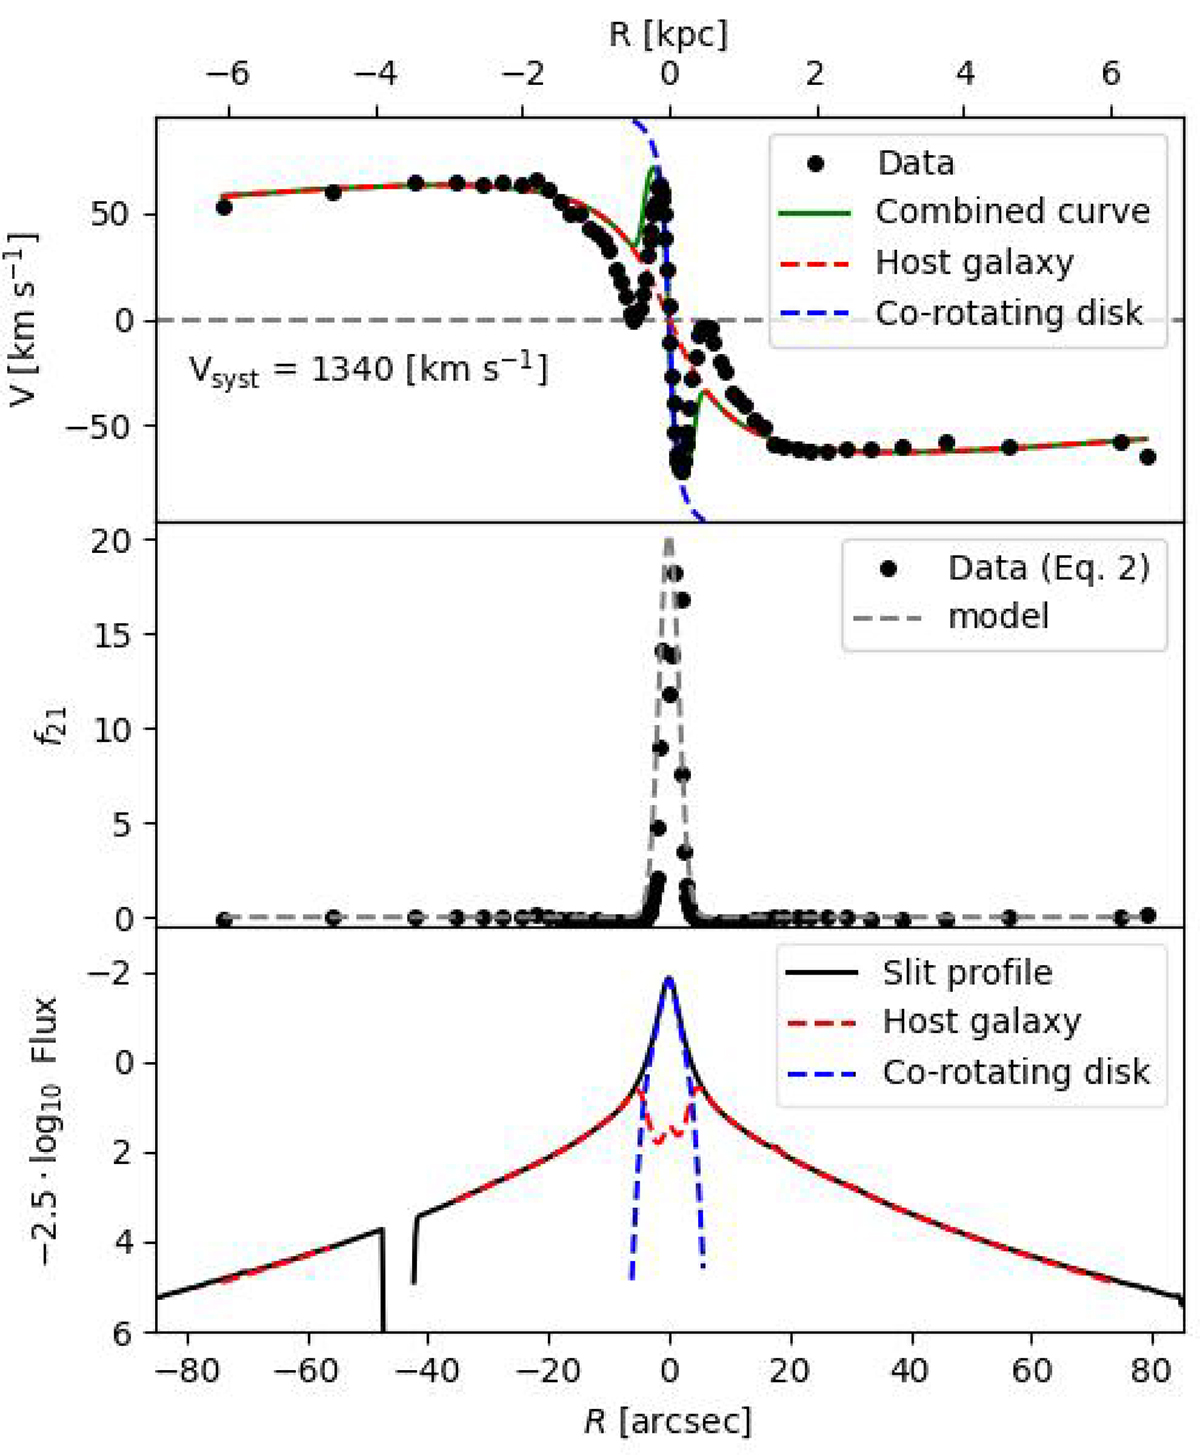
Fig. 2.
Download original image
Toy model of a co-rotating stellar disk. Top panel: Measured radial profiles of line-of-sight velocity (black circle) and best-fitting rotation curves for the co-rotating disk (dashed blue line) and the host galaxy (solid red line) as determined by Eq. (1). Middle panel: Flux ratio f12 as determined from Eq. (2) (black circle) and its best-fitting Gaussian model (gray dashed line). Bottom panel: Surface-brightness profiles of the galaxy along the slit (black solid line, obtained by integrating the observed spectrum along the wavelength direction), of the KDC (dashed blue line) and the host galaxy (dashed red line) as obtained assuming the best-fit model for their flux ratios. The radial profile of f12 in the middle panel indicates that the co-rotating stellar disk dominates the total flux within 6″.
Current usage metrics show cumulative count of Article Views (full-text article views including HTML views, PDF and ePub downloads, according to the available data) and Abstracts Views on Vision4Press platform.
Data correspond to usage on the plateform after 2015. The current usage metrics is available 48-96 hours after online publication and is updated daily on week days.
Initial download of the metrics may take a while.