Fig. A.2.
Download original image
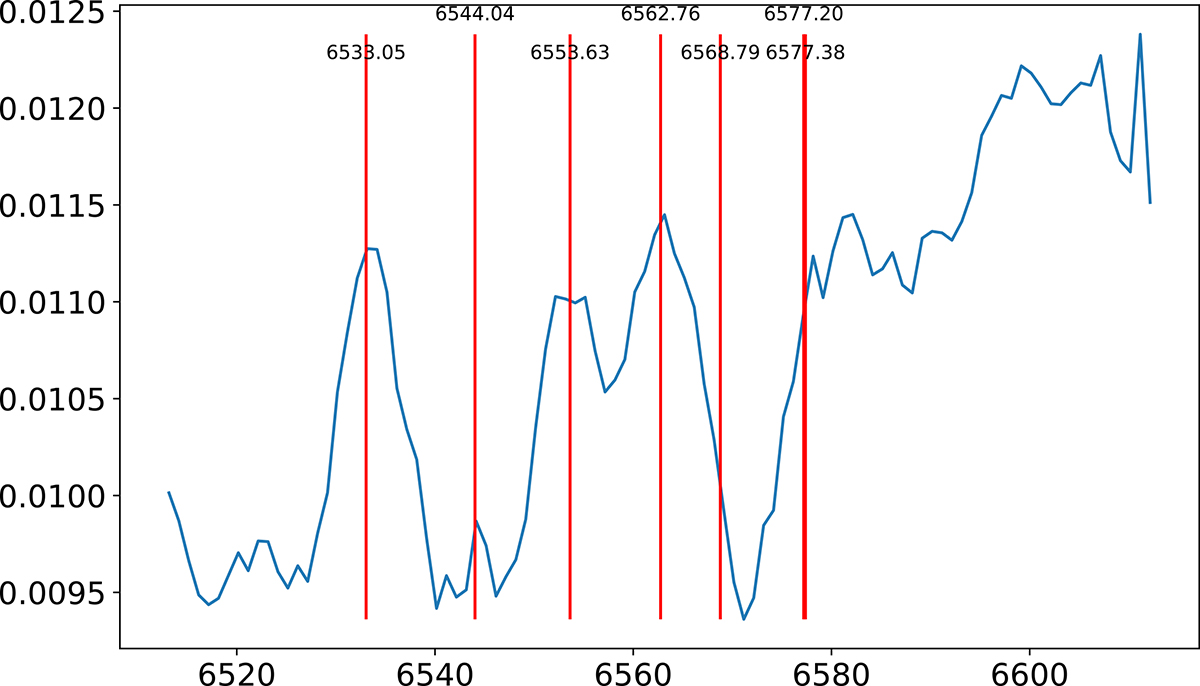
Example of wavelength transformation correction. The red vertical lines mark the strong sky lines with high typical peak intensities from an atlas of optical sky emission (see details in the text). The x-axis represents the wavelength, while the y-axis represents the intensity in arbitrary units. In this example, three sky lines are identified (λ = 6533.05, 6553.63, 6562.76 Å). After correcting the wavelength transformation, the observed sky lines align correctly with the wavelengths from the atlas.
Current usage metrics show cumulative count of Article Views (full-text article views including HTML views, PDF and ePub downloads, according to the available data) and Abstracts Views on Vision4Press platform.
Data correspond to usage on the plateform after 2015. The current usage metrics is available 48-96 hours after online publication and is updated daily on week days.
Initial download of the metrics may take a while.