Fig. 3.
Download original image
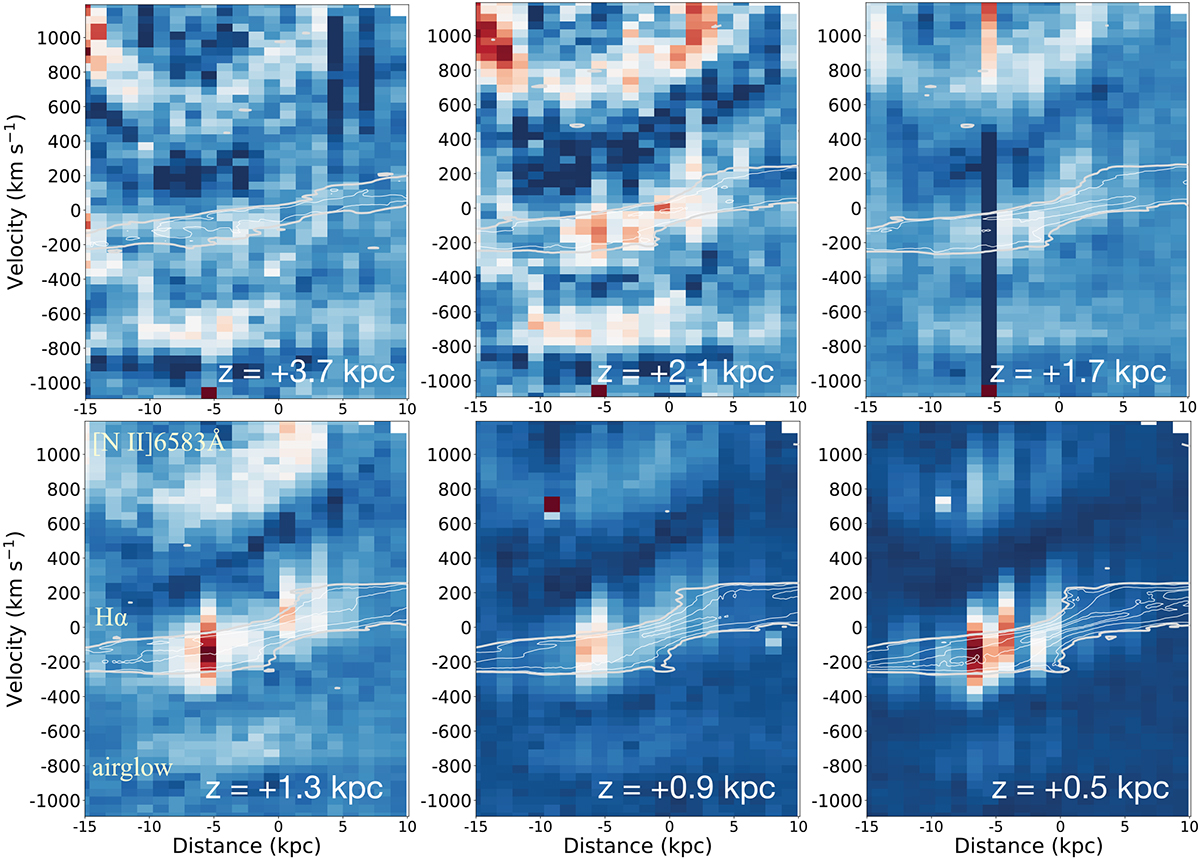
The position-velocity (PV) diagrams at different heights away from the disk of NGC 891 constructed with optical emission lines from our multi-slit narrow-band spectroscopy observations, with the brightness in arbitrary units. The x-axis is the distance along the major axis. The overlaid white contours are the H I 21 cm emission PV diagram constructed with high-resolution (white thin lines) and low-resolution (outermost light-grey thick line) data cubes from HALOGAS Data Release 1 (Heald et al. 2011; Oosterloo et al. 2007). Contour levels are 3σ for the low-resolution data. We bin 30 pixels (∼8.2″) along the slit direction to increase the S/N. The two parallel bands of bright features are produced by the Hα line (lower) and the [N II]λ6583 Å line (upper), respectively. The lowest bright band with constant velocity is contributed by the airglow, which is mixed with the [N II]λ6548 Å line. The pixel scales of the optical and the H I spectra are ∼45.7 km s−1 (velocity resolution ∼190 km s−1) and ∼8.2 km s−1 (velocity resolution ∼16.4 km s−1), respectively, due to which the bright features on the PV diagram have different vertical extents. The slope of the two PV diagrams are comparable to each other, indicating the two gas phases have comparable rotation velocities, and no signatures of global outflows/inflows have been revealed.
Current usage metrics show cumulative count of Article Views (full-text article views including HTML views, PDF and ePub downloads, according to the available data) and Abstracts Views on Vision4Press platform.
Data correspond to usage on the plateform after 2015. The current usage metrics is available 48-96 hours after online publication and is updated daily on week days.
Initial download of the metrics may take a while.