Fig. 2.
Download original image
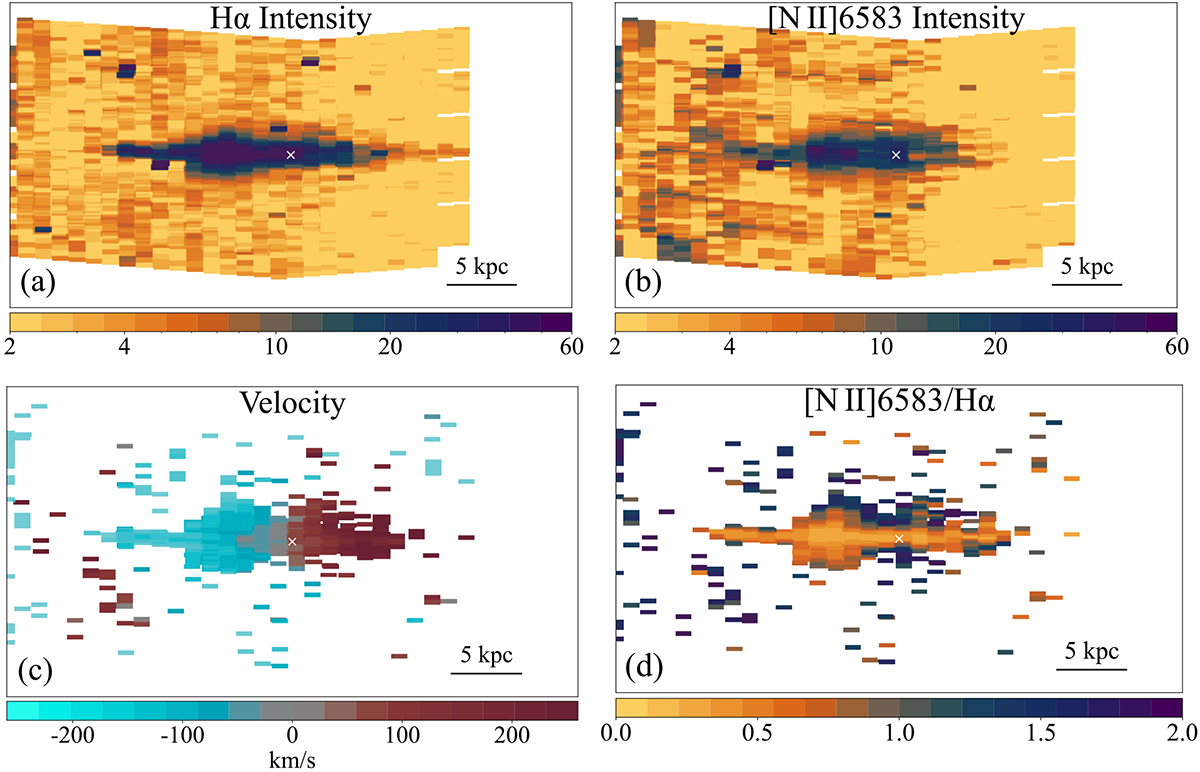
Calibrated data and initial results from the multi-slit spectroscopy observations of NGC 891. Panels a and b show the Hα and [N II]λ6583 Å line intensities in arbitrary units. Panel c shows the line centroid velocity jointly estimated from both the Hα and the [N II]λ6583 Å lines. Panel d shows the [N II]λ6583 Å-to-Hα line intensity ratio. The white cross in each panel marks the galactic centre. The cut criteria for panels c and d are S/NHα > 6 and S/N![]() . The large number of spurious detections in the halo are caused by the misidentification of the residual sky lines.
. The large number of spurious detections in the halo are caused by the misidentification of the residual sky lines.
Current usage metrics show cumulative count of Article Views (full-text article views including HTML views, PDF and ePub downloads, according to the available data) and Abstracts Views on Vision4Press platform.
Data correspond to usage on the plateform after 2015. The current usage metrics is available 48-96 hours after online publication and is updated daily on week days.
Initial download of the metrics may take a while.