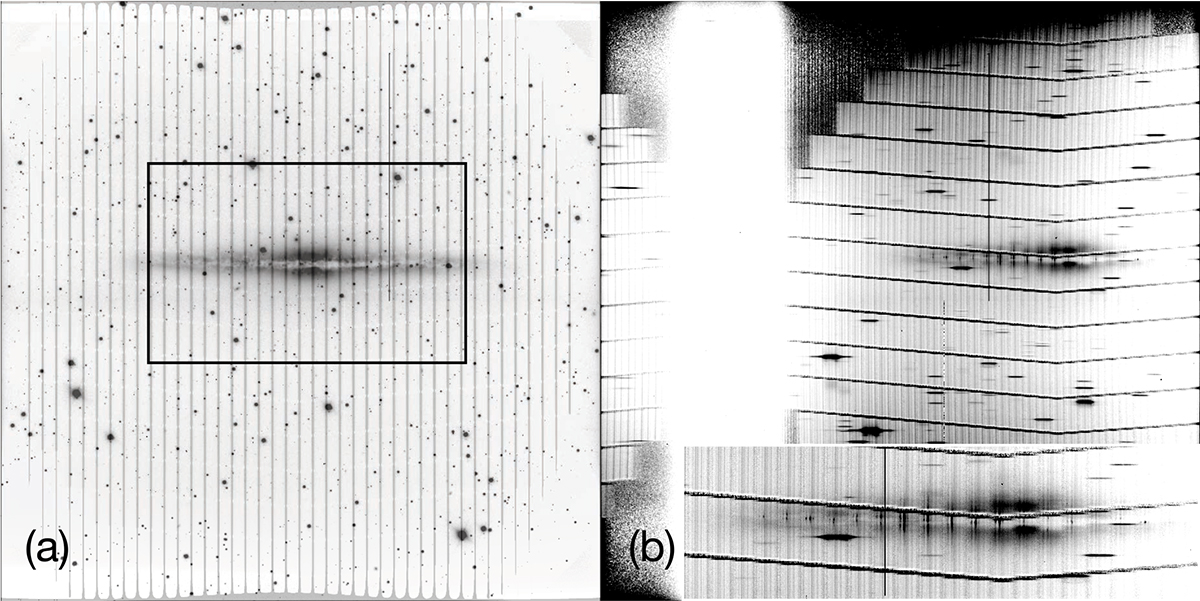
Fig. 1.
Download original image
Raw images from the multi-slit narrow-band spectroscopy of NGC 891. The intensity scale is inverted such that bright emission is black. The instrument (OSMOS) has been rotated for 68° so the galactic disk is placed perpendicular to the slits. (a) Slit image overlaid on a snapshot Hα image, taken with the same filter KP1468 as the spectroscopy observations, and with the exposures of 3 × 60 s. The black box indicates the region shown in Fig. 2. (b) Raw spectra taken with the multi-slit mask and the KP1468 Hα narrow-band filter. The image in the leftmost side should be higher-order spectra of the rightmost slits, which are not used in the follow-up analysis. Each rectangle is a narrow-band spectrum with the 60″ slit segment, that traces spatial length in the vertical direction and wavelength spanning the slimmer horizontal direction. The inset panel shows a zoom-in of the central region, where the three prominent emission lines (Hα, [N II]λλ6548, 6583 Å) can be clearly seen as bright vertical lines.
Current usage metrics show cumulative count of Article Views (full-text article views including HTML views, PDF and ePub downloads, according to the available data) and Abstracts Views on Vision4Press platform.
Data correspond to usage on the plateform after 2015. The current usage metrics is available 48-96 hours after online publication and is updated daily on week days.
Initial download of the metrics may take a while.