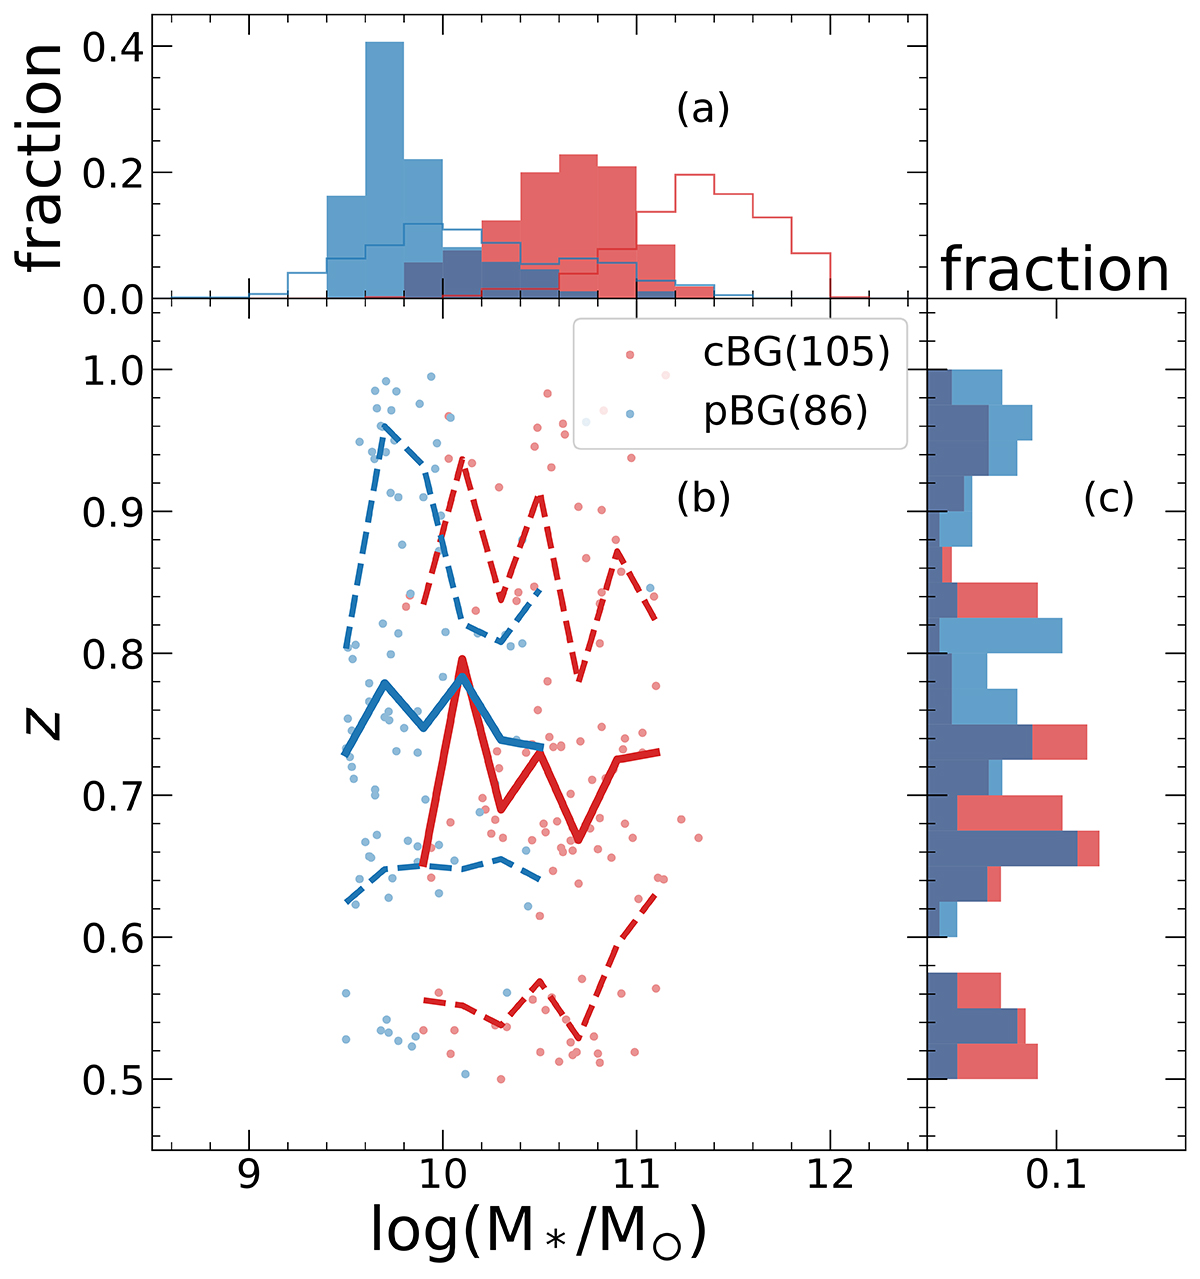
Fig. 3.
Download original image
Distributions of galaxy total stellar mass and redshift for our selected classical bulge galaxies (cBG: red symbols) and pseudo-bulge galaxies (pBG: blue symbols). Panel (b) presents redshift as a function of galaxy total stellar mass. Each dot indicates an individual galaxy. The solid lines show median relations and dashed lines enclose 68% scatter. Panels (a) and (c) present the distributions of the two properties respectively. In panel (a), unfilled histograms are over-plotted, showing distributions of samples at low-redshift from the previous work of Hu et al. (2024).
Current usage metrics show cumulative count of Article Views (full-text article views including HTML views, PDF and ePub downloads, according to the available data) and Abstracts Views on Vision4Press platform.
Data correspond to usage on the plateform after 2015. The current usage metrics is available 48-96 hours after online publication and is updated daily on week days.
Initial download of the metrics may take a while.