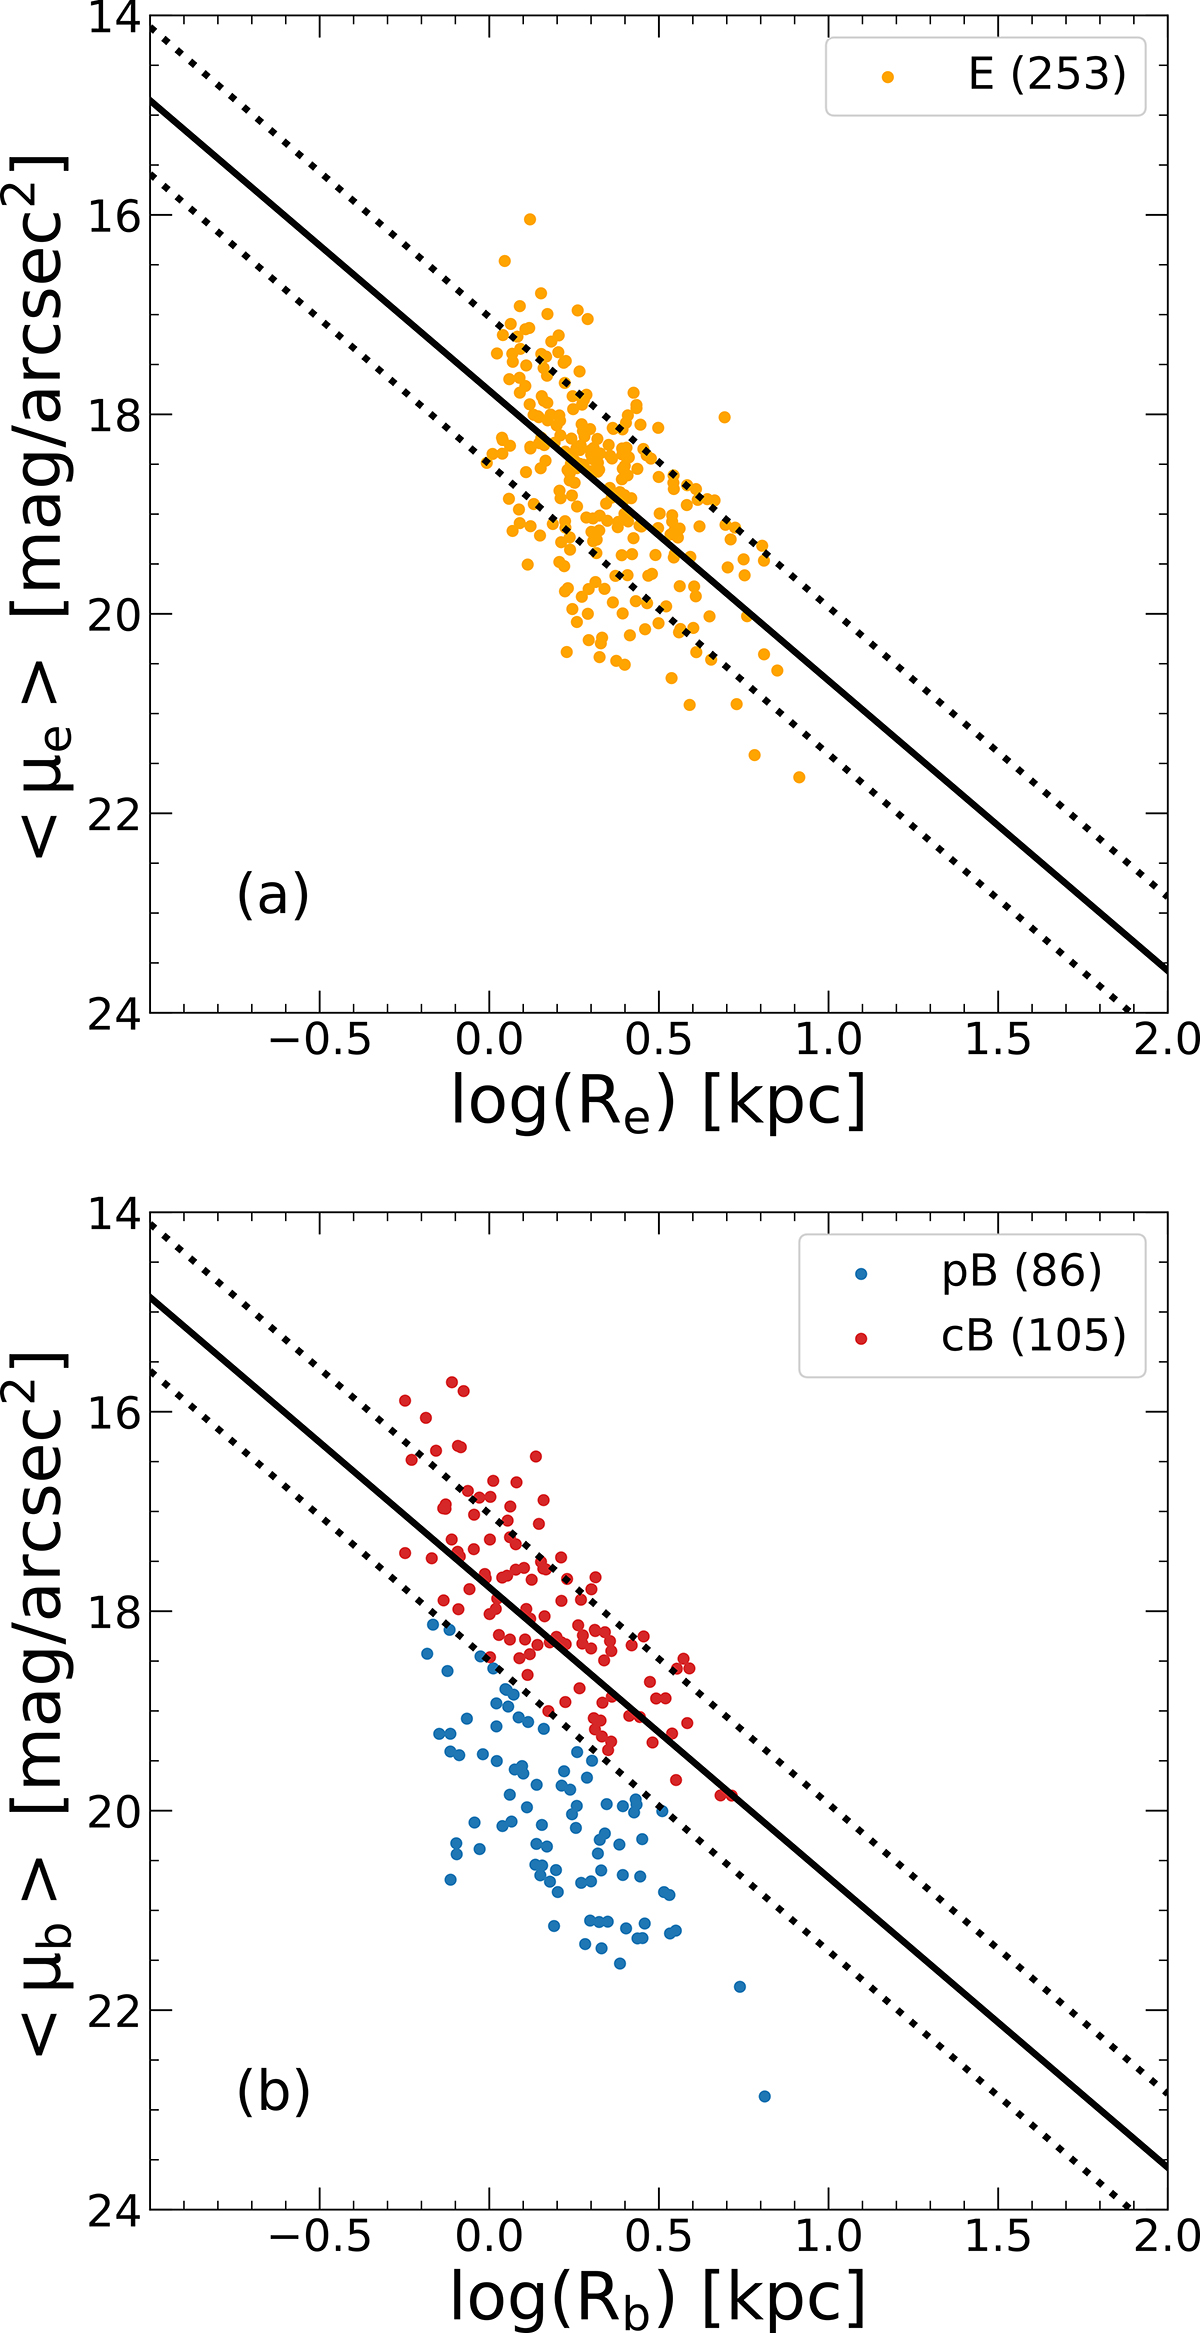
Fig. 2.
Download original image
The Kormendy relation. Panel (a): The Kormendy relation of our selected elliptical galaxies (E) in F160W band. The orange dots represent individual elliptical galaxies, and the black solid line is the best linear fitting of these dots. The two black dotted lines show the ±1σ scatter (σ = 0.74). Panel (b): On the Kormendy diagram, the positions of classical bulges (cB: red dots) and pseudo-bulges (pB: blue dots) constrained by both nb and Kormendy relation are plotted.
Current usage metrics show cumulative count of Article Views (full-text article views including HTML views, PDF and ePub downloads, according to the available data) and Abstracts Views on Vision4Press platform.
Data correspond to usage on the plateform after 2015. The current usage metrics is available 48-96 hours after online publication and is updated daily on week days.
Initial download of the metrics may take a while.