Fig. 6
Download original image
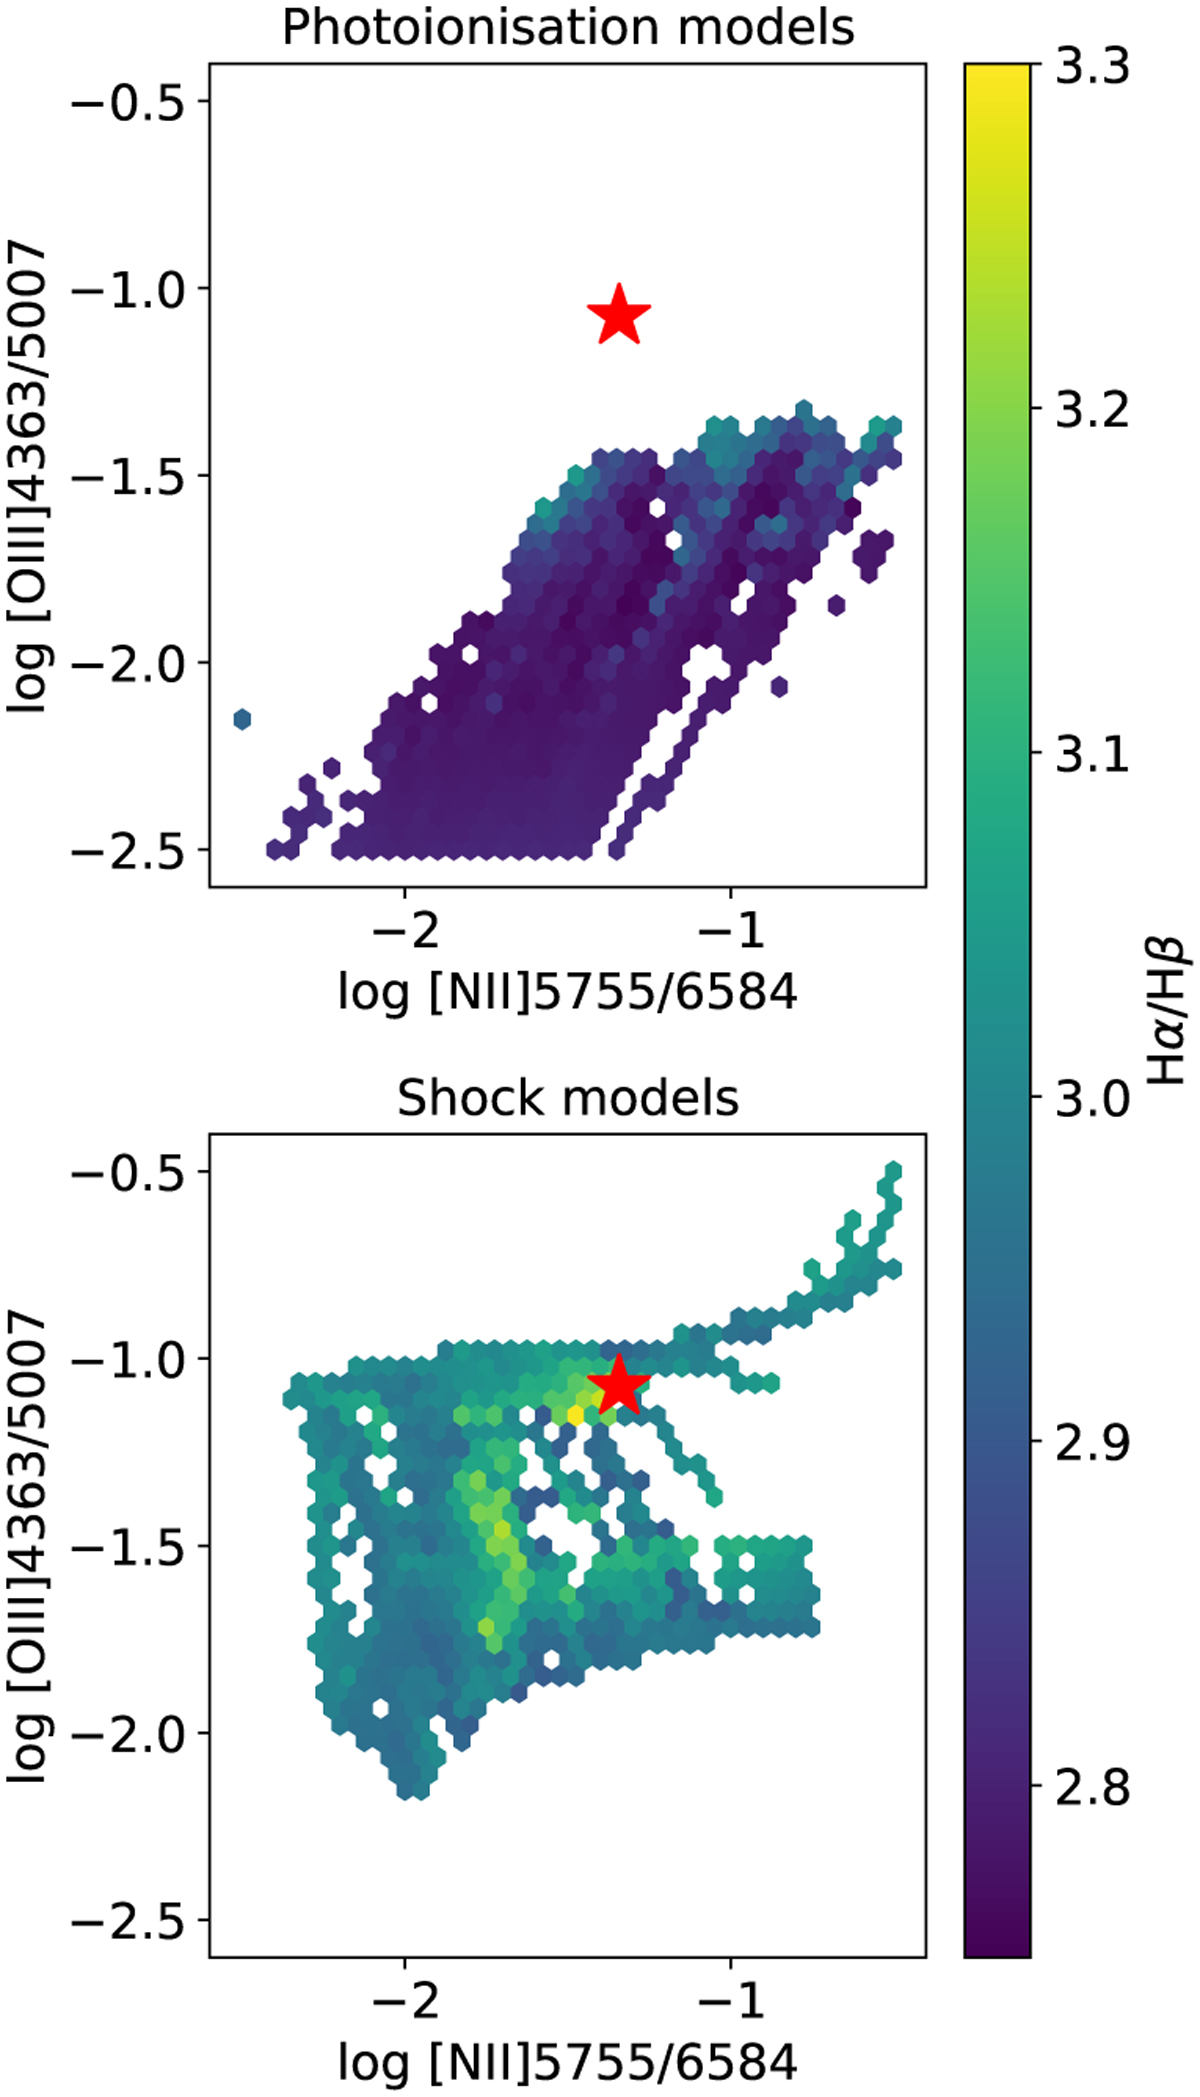
Location of models from the 3MdB database (see text for details) in an [O III]4363/5007 vs. [N II]]5755/6584 diagram. The top panel shows models of the PNe, and the bottom panel shows shock and shock+precursor models. The colour code for the models corresponds to the Hα/Hβ line intensity ratio. The red star shows the location of the 2021 observations of IRAS 22568.
Current usage metrics show cumulative count of Article Views (full-text article views including HTML views, PDF and ePub downloads, according to the available data) and Abstracts Views on Vision4Press platform.
Data correspond to usage on the plateform after 2015. The current usage metrics is available 48-96 hours after online publication and is updated daily on week days.
Initial download of the metrics may take a while.