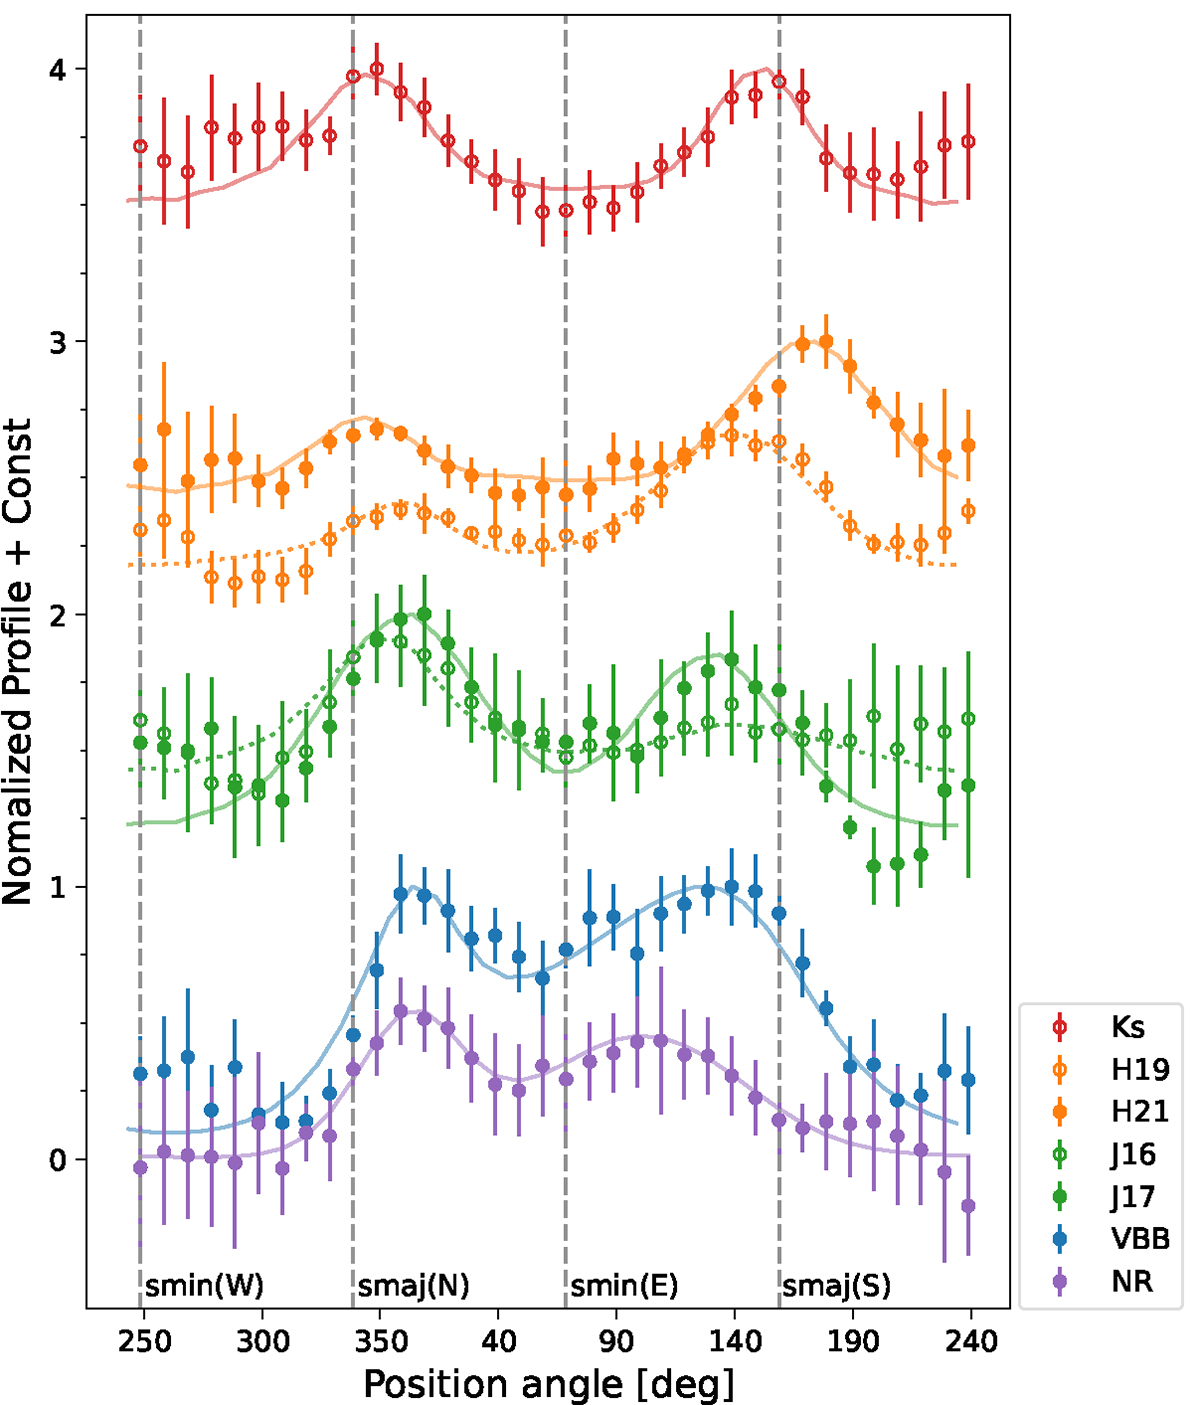
Fig. 3.
Download original image
Azimuthal profile of the Qφ(φ) images averaged over an annulus of 35–70 au. The colored dots are calculated from the observations, with the uncertainties being the standard deviation over all selected cycles. The overplotted curves are calculated from the convolved fitted model. The vertical dashed lines indicate the position angles of the minor axis, smin(W) and smin(E), in the west and east directions, and the major axis, smaj(N) and smaj(S), in the north and south directions.
Current usage metrics show cumulative count of Article Views (full-text article views including HTML views, PDF and ePub downloads, according to the available data) and Abstracts Views on Vision4Press platform.
Data correspond to usage on the plateform after 2015. The current usage metrics is available 48-96 hours after online publication and is updated daily on week days.
Initial download of the metrics may take a while.