Fig. 1.
Download original image
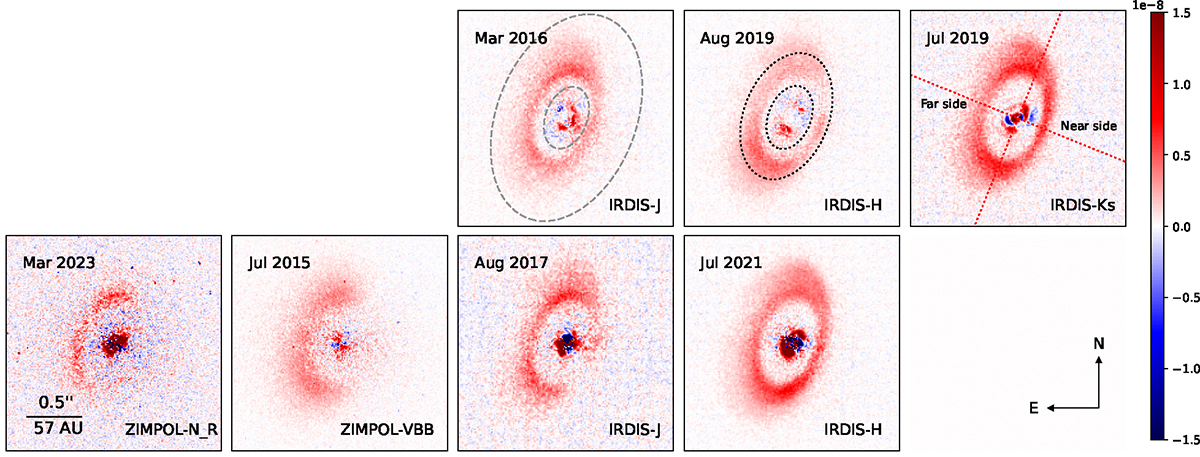
Mean polarized intensity images Qφ(x, y) for N_R, VBB, J, H, and Ks band. All images are normalized to the stellar intensity I⋆ and divided by their pixel areas (3.6 × 3.6 mas2 for ZIMPOL and 12.25 × 12.25 mas2 for IRDIS) to provide the surface brightness contrast in mas−2, as indicated by the color bar. The first and the second rows present coronagraphic and non-coronagraphic observations respectively. The shared color bar is indicated on the right. The epochs are indicated on the top left in each panel. The grey dashed line in the J-band panel indicates the integrated region for disk signals. The black dotted line in the H panel indicates the deprojected region used to calculate the azimuthal profile. Up is to the north and left is to the east.
Current usage metrics show cumulative count of Article Views (full-text article views including HTML views, PDF and ePub downloads, according to the available data) and Abstracts Views on Vision4Press platform.
Data correspond to usage on the plateform after 2015. The current usage metrics is available 48-96 hours after online publication and is updated daily on week days.
Initial download of the metrics may take a while.