Fig. 6.
Download original image
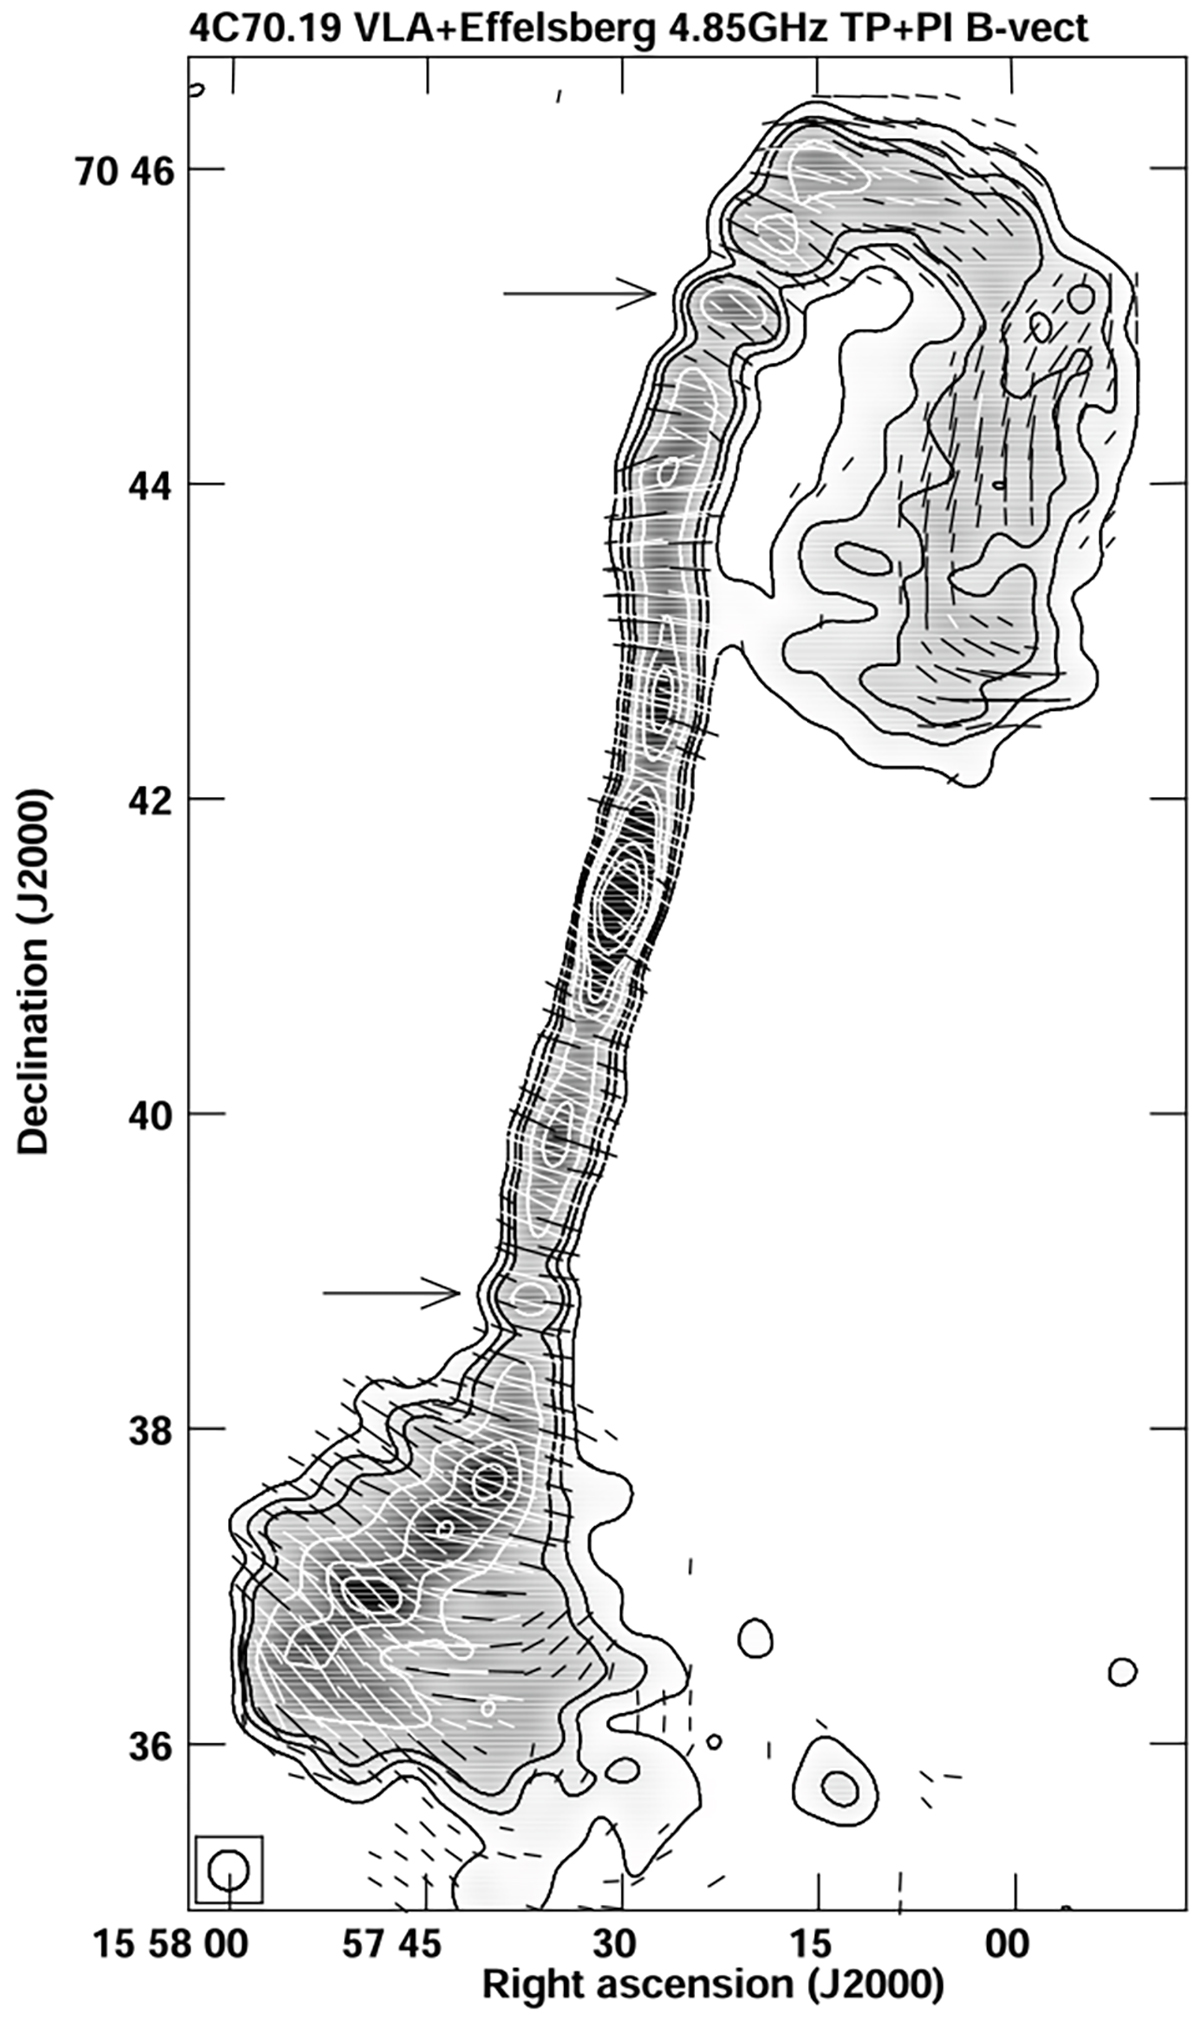
Merged map of 4C 70.19 at 4.85 GHz produced from the Effelsberg single-dish map and the VLA interferometer maps in C and D configurations. The contours are (3, 6, 9, 16, 25, 32, 64, and 96) × 0.29 mJy beam−1. The lines show the orientation of the magnetic field and a length of 1′ corresponds to polarised emission of 3.3 mJy beam−1. The beam size of 15″ is presented in the bottom left corner of the image. The two arrows point at bright knots of the radio emission (see Sect. 4.2.2 for details).
Current usage metrics show cumulative count of Article Views (full-text article views including HTML views, PDF and ePub downloads, according to the available data) and Abstracts Views on Vision4Press platform.
Data correspond to usage on the plateform after 2015. The current usage metrics is available 48-96 hours after online publication and is updated daily on week days.
Initial download of the metrics may take a while.