Fig. 19.
Download original image
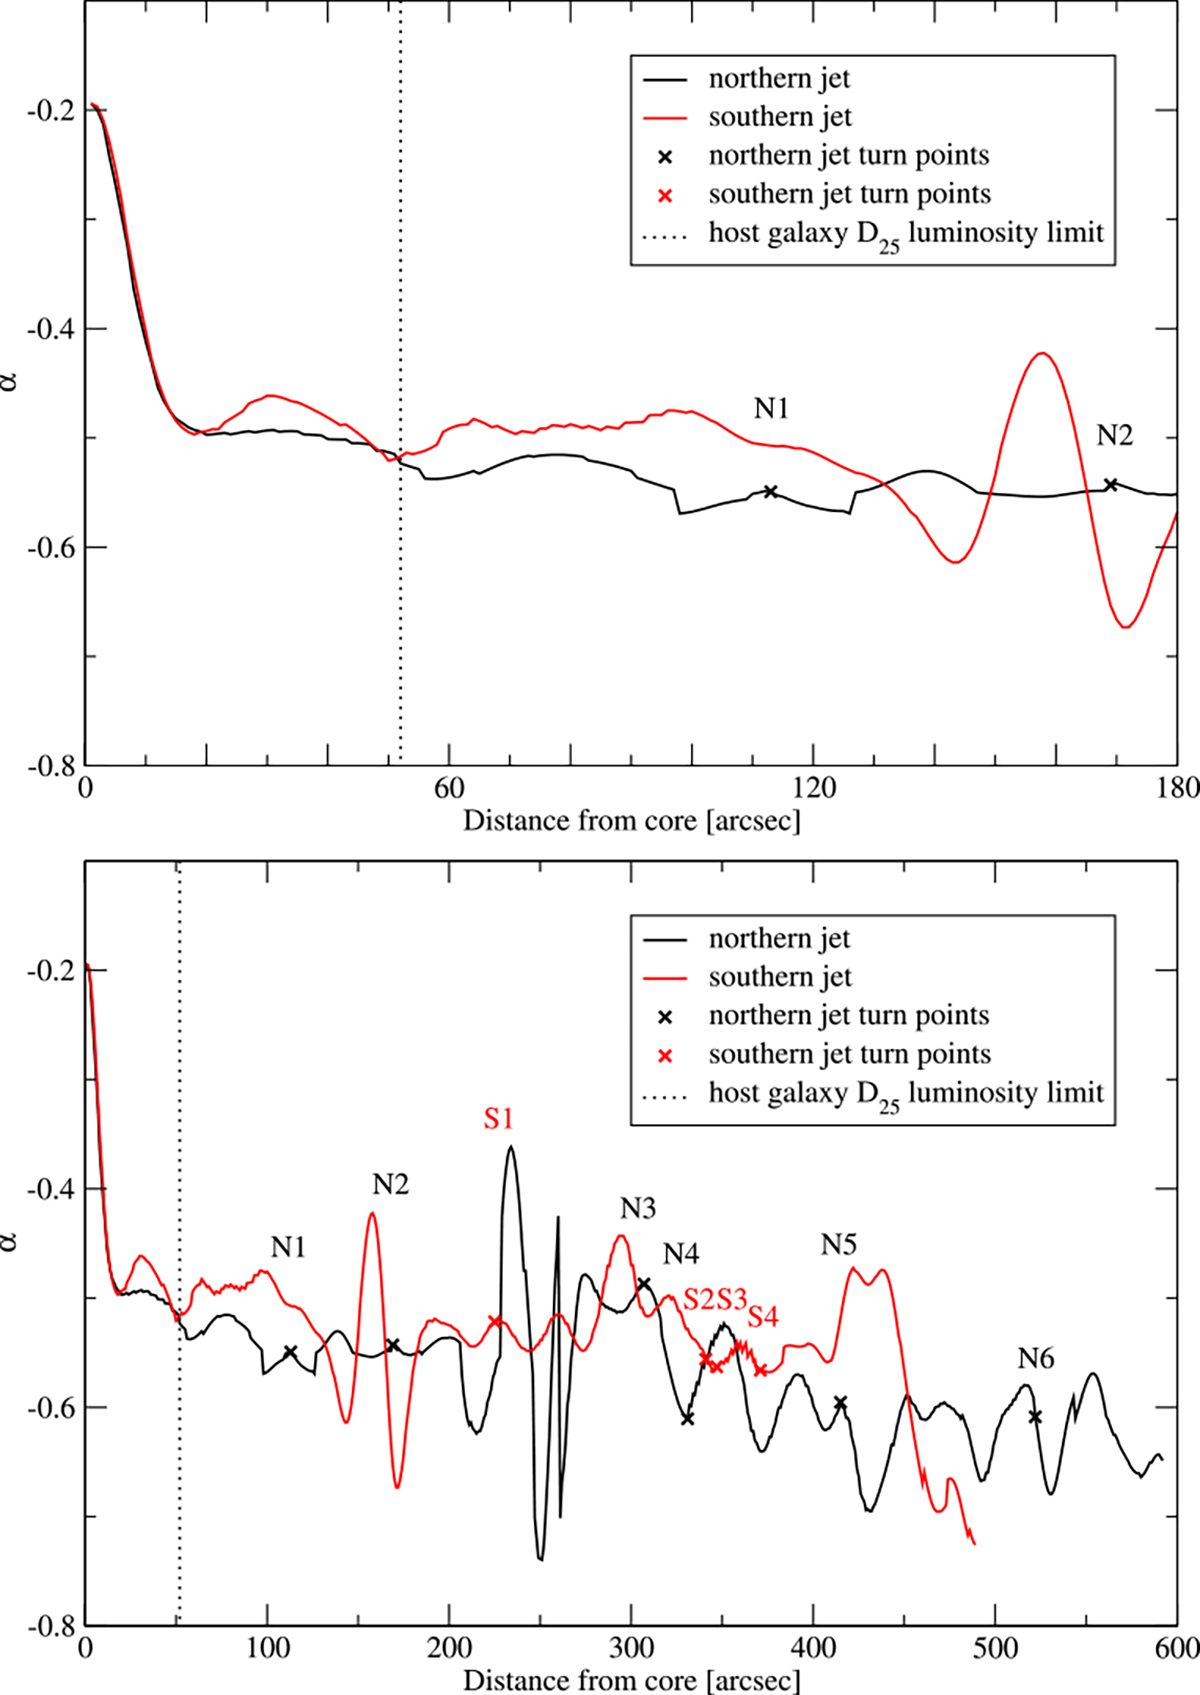
Spectral index profiles along the jet propagation lines of 4C 70.19. Top: Profiles measured in the spectral index map between 145 and 4850 MHz (left panel of Fig. 18). The plot is limited to 3′ from the core to better present the inner parts of the jets. Bottom: Profiles as in the upper panel, but along the entire propagation path. In both panels the vertical dashed line marks the optical D25 luminosity limit of the host galaxy NGC 6048 and the main turning points of the jets are marked with crosses and labelled in corresponding colour.
Current usage metrics show cumulative count of Article Views (full-text article views including HTML views, PDF and ePub downloads, according to the available data) and Abstracts Views on Vision4Press platform.
Data correspond to usage on the plateform after 2015. The current usage metrics is available 48-96 hours after online publication and is updated daily on week days.
Initial download of the metrics may take a while.