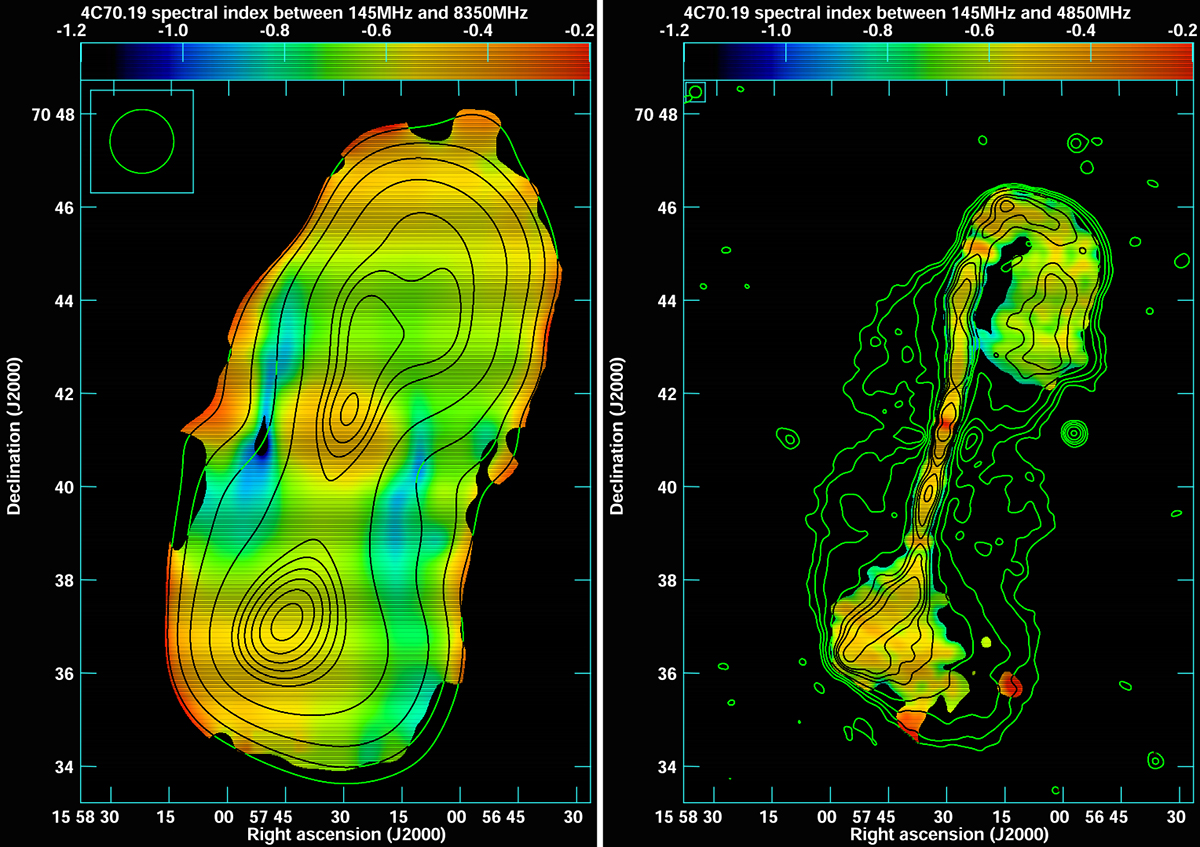
Fig. 18.
Download original image
Spectral index maps of 4C 70.19. Left: Map between 145 MHz (LOFAR) and 8350 MHz (Effelsberg) overlaid with contours of the former map. The contour levels are (3, 10, 30, 100, 250, 300, 350, 400, 450, and 500) × 1.8 mJy beam−1. The beam size of 82″ is presented in the upper left corner of the image. Right: Map between 145 MHz (LOFAR) and 4850 MHz (VLA+Effelsberg) overlaid with contours of the LOFAR map convolved to the resolution of the latter map. The contour levels are (3, 8, 16, 32, 64, 80, 96, 128, and 256) × 0.32 mJy beam−1. The beam size of 15″ is presented in the upper left corner of the image.
Current usage metrics show cumulative count of Article Views (full-text article views including HTML views, PDF and ePub downloads, according to the available data) and Abstracts Views on Vision4Press platform.
Data correspond to usage on the plateform after 2015. The current usage metrics is available 48-96 hours after online publication and is updated daily on week days.
Initial download of the metrics may take a while.