Fig. 12.
Download original image
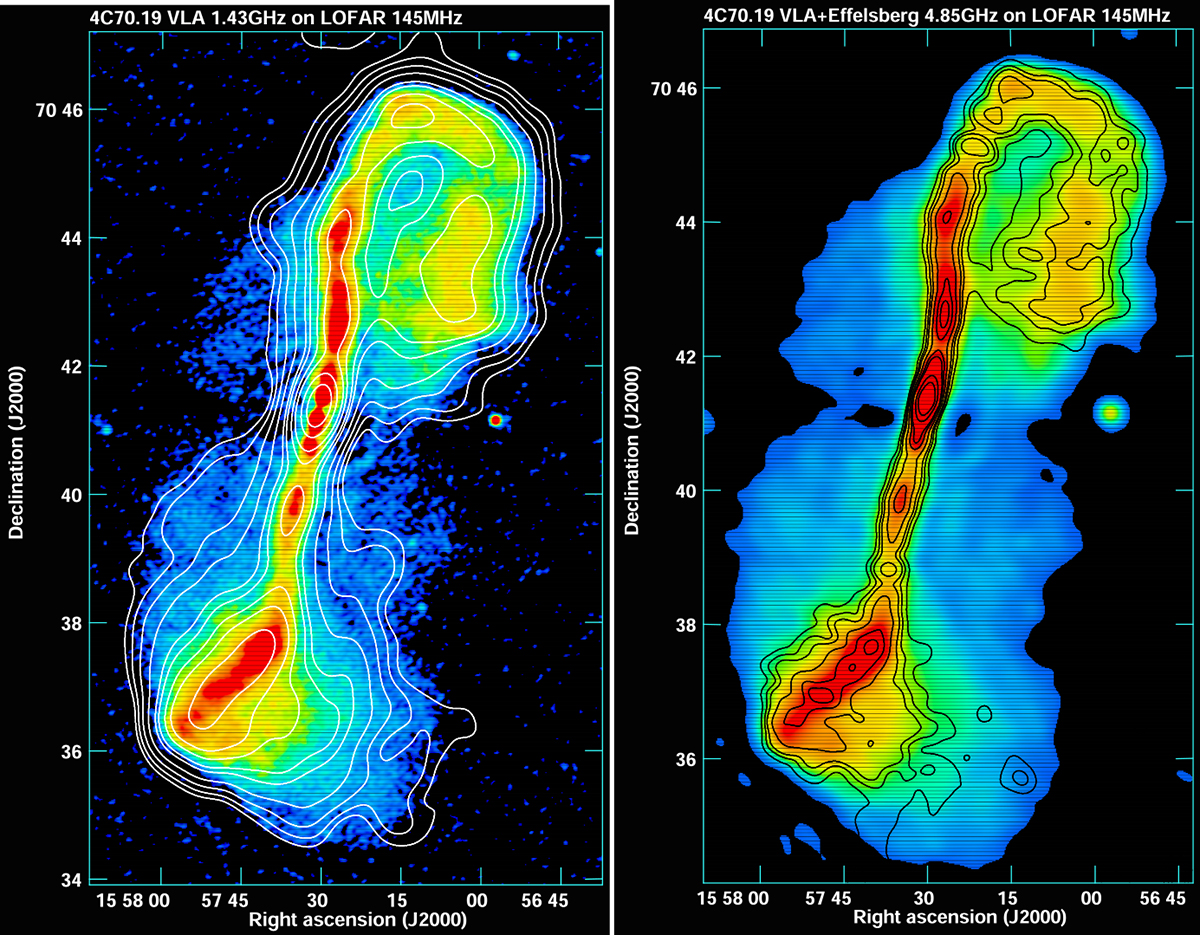
VLA maps of 4C 70.19 overlaid on its LOFAR map. Left: VLA map of 4C 70.19 at 1.43 GHz from Fig. 4 on the colour image of the LOFAR map at 145 MHz from Fig. 1. The contour levels are (3, 6, 12, 24, 48, 64, 96, 128, 192, and 256) × 0.37 mJy beam−1. Right: VLA+Effelsberg map of 4C 70.19 at 4.85 GHz on the colour image of the LOFAR map at 145 MHz. The latter map was convolved to 15″. The contours are (3, 6, 9, 16, 25, 32, 64, and 96) × 0.29 mJy beam−1.
Current usage metrics show cumulative count of Article Views (full-text article views including HTML views, PDF and ePub downloads, according to the available data) and Abstracts Views on Vision4Press platform.
Data correspond to usage on the plateform after 2015. The current usage metrics is available 48-96 hours after online publication and is updated daily on week days.
Initial download of the metrics may take a while.