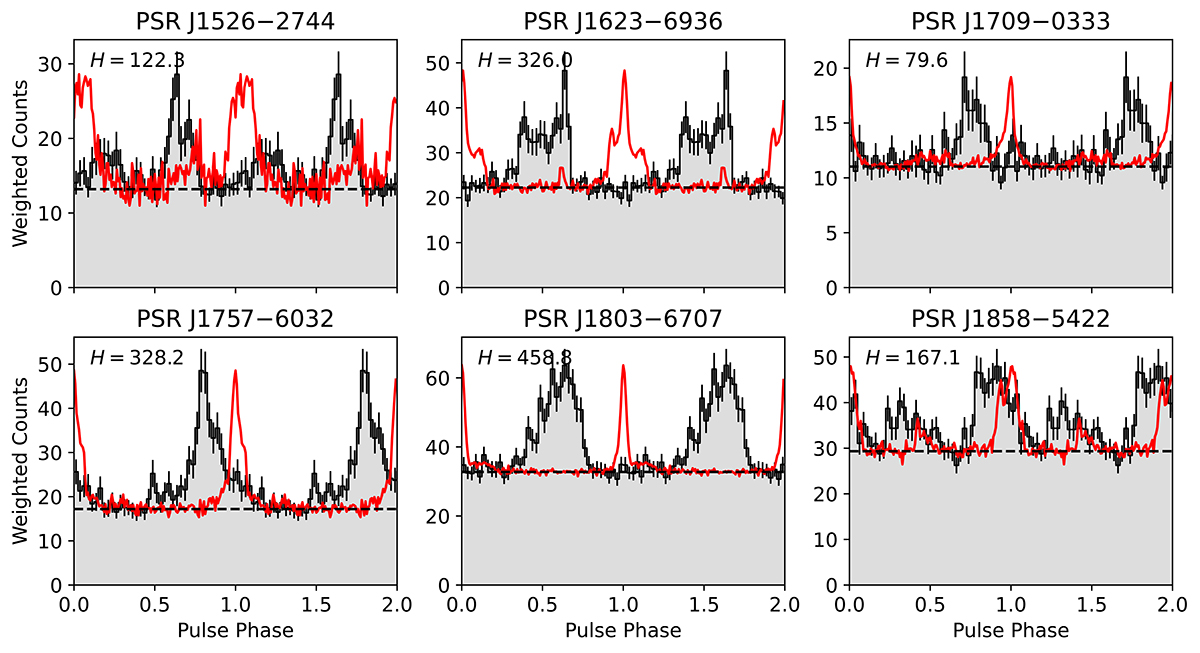
Fig. 8.
Download original image
Phase-aligned radio (red curves) and gamma-ray (grey histograms) pulse profiles. The gamma-ray background level, estimated from the distribution of photon weights as b = ∑iwi(1 − wi)/nbins, is shown by dashed horizontal black lines. Radio pulse profiles are in arbitrary flux density units, scaled to match the same pulse amplitude as the gamma-ray peak, and with the baseline flux matching the gamma-ray background level.
Current usage metrics show cumulative count of Article Views (full-text article views including HTML views, PDF and ePub downloads, according to the available data) and Abstracts Views on Vision4Press platform.
Data correspond to usage on the plateform after 2015. The current usage metrics is available 48-96 hours after online publication and is updated daily on week days.
Initial download of the metrics may take a while.