Open Access
Fig. 7.
Download original image
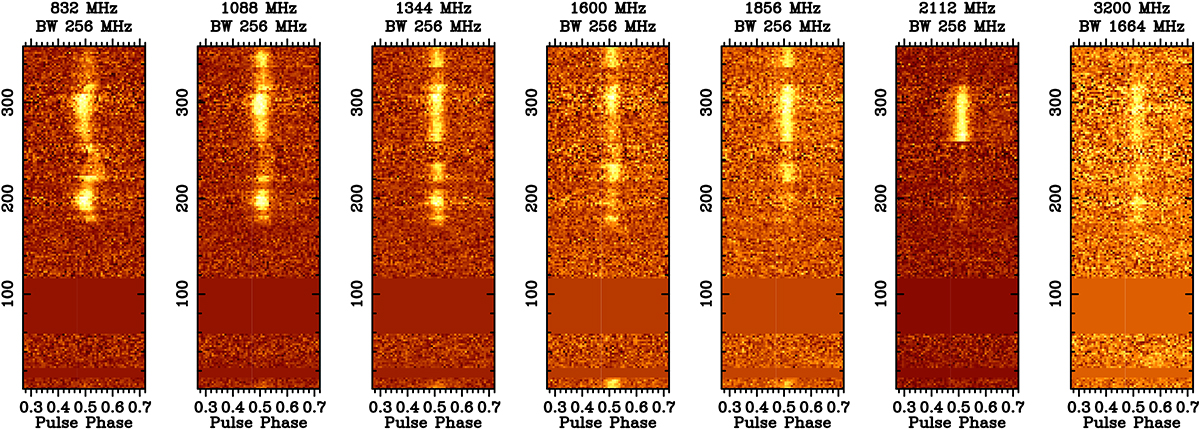
Waterfall plots representing the orbital light curves (longitude with respect to the ascending node vs pulse phase) for PSR J1803−6707 in different frequency sub-bands. The central frequency and bandwidth are marked on the top of each panel. Only a pulse phase range of 0.4 around the peak is plotted.
Current usage metrics show cumulative count of Article Views (full-text article views including HTML views, PDF and ePub downloads, according to the available data) and Abstracts Views on Vision4Press platform.
Data correspond to usage on the plateform after 2015. The current usage metrics is available 48-96 hours after online publication and is updated daily on week days.
Initial download of the metrics may take a while.