Fig. 6.
Download original image
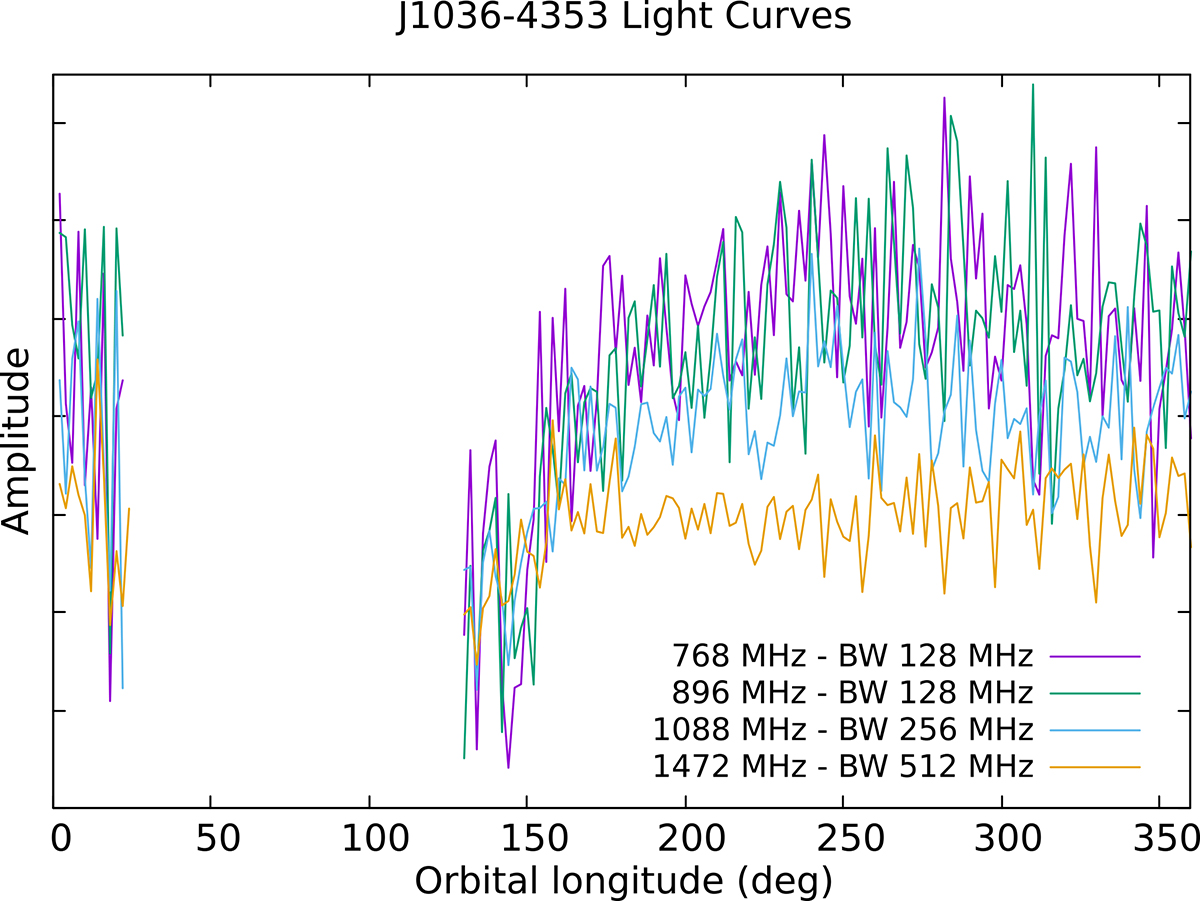
Amplitude of the pulsed radio emission as a function of the longitude from the ascending node for PSR J1036−4353 in four different frequency sub-bands. The amplitude is measured over a pulse phase range of 0.2 around the peak. The central frequency and bandwidth of each sub-band are reported in the bottom-right corner. Points between longitudes 22° and 130° have not been plotted either because no data at all (between 34° and 94°) or not enough data had been recorded, resulting in a much higher level of noise.
Current usage metrics show cumulative count of Article Views (full-text article views including HTML views, PDF and ePub downloads, according to the available data) and Abstracts Views on Vision4Press platform.
Data correspond to usage on the plateform after 2015. The current usage metrics is available 48-96 hours after online publication and is updated daily on week days.
Initial download of the metrics may take a while.