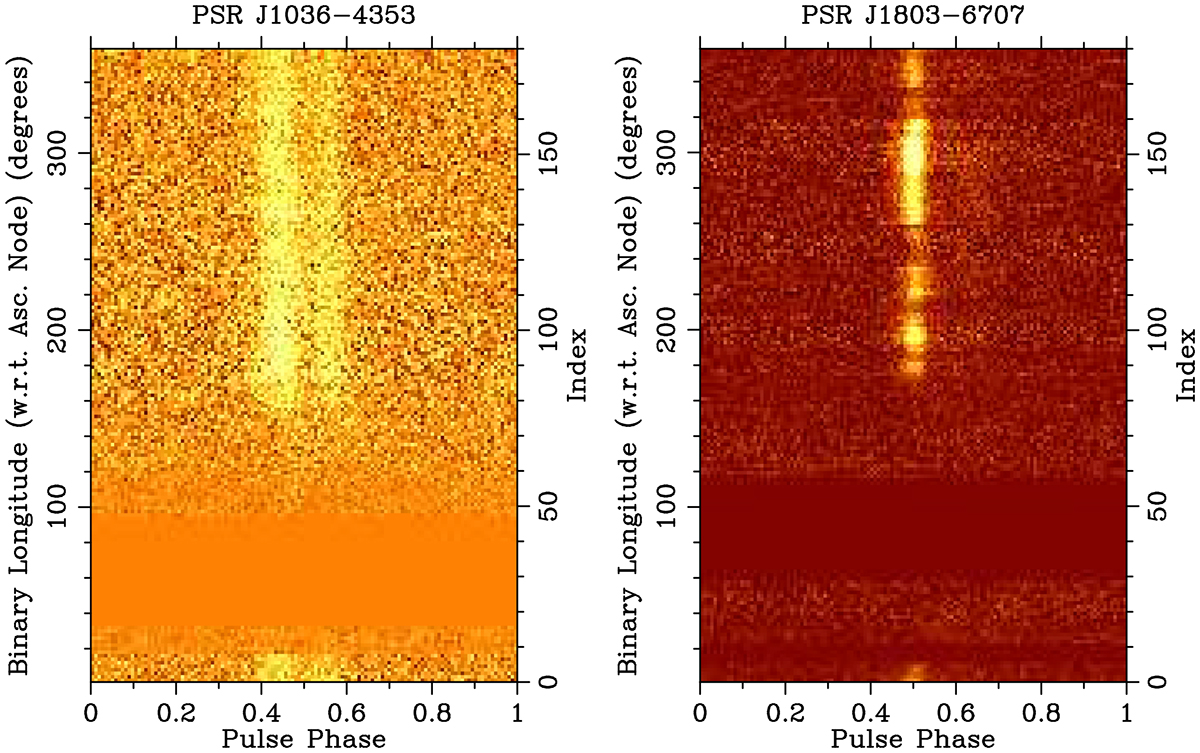
Fig. 5.
Download original image
Waterfall plots showing, for the two RB pulsars J1036−4353 and J1803−6707, orbital longitude (with respect to the ascending node) versus pulse phase. The brighter the colour-scale, the stronger the signal. Orbital longitude ranges where the plots show a solid colour have no associated data, as observations were planned to avoid the eclipses. Data are from the Parkes telescope.
Current usage metrics show cumulative count of Article Views (full-text article views including HTML views, PDF and ePub downloads, according to the available data) and Abstracts Views on Vision4Press platform.
Data correspond to usage on the plateform after 2015. The current usage metrics is available 48-96 hours after online publication and is updated daily on week days.
Initial download of the metrics may take a while.