Fig. 2.
Download original image
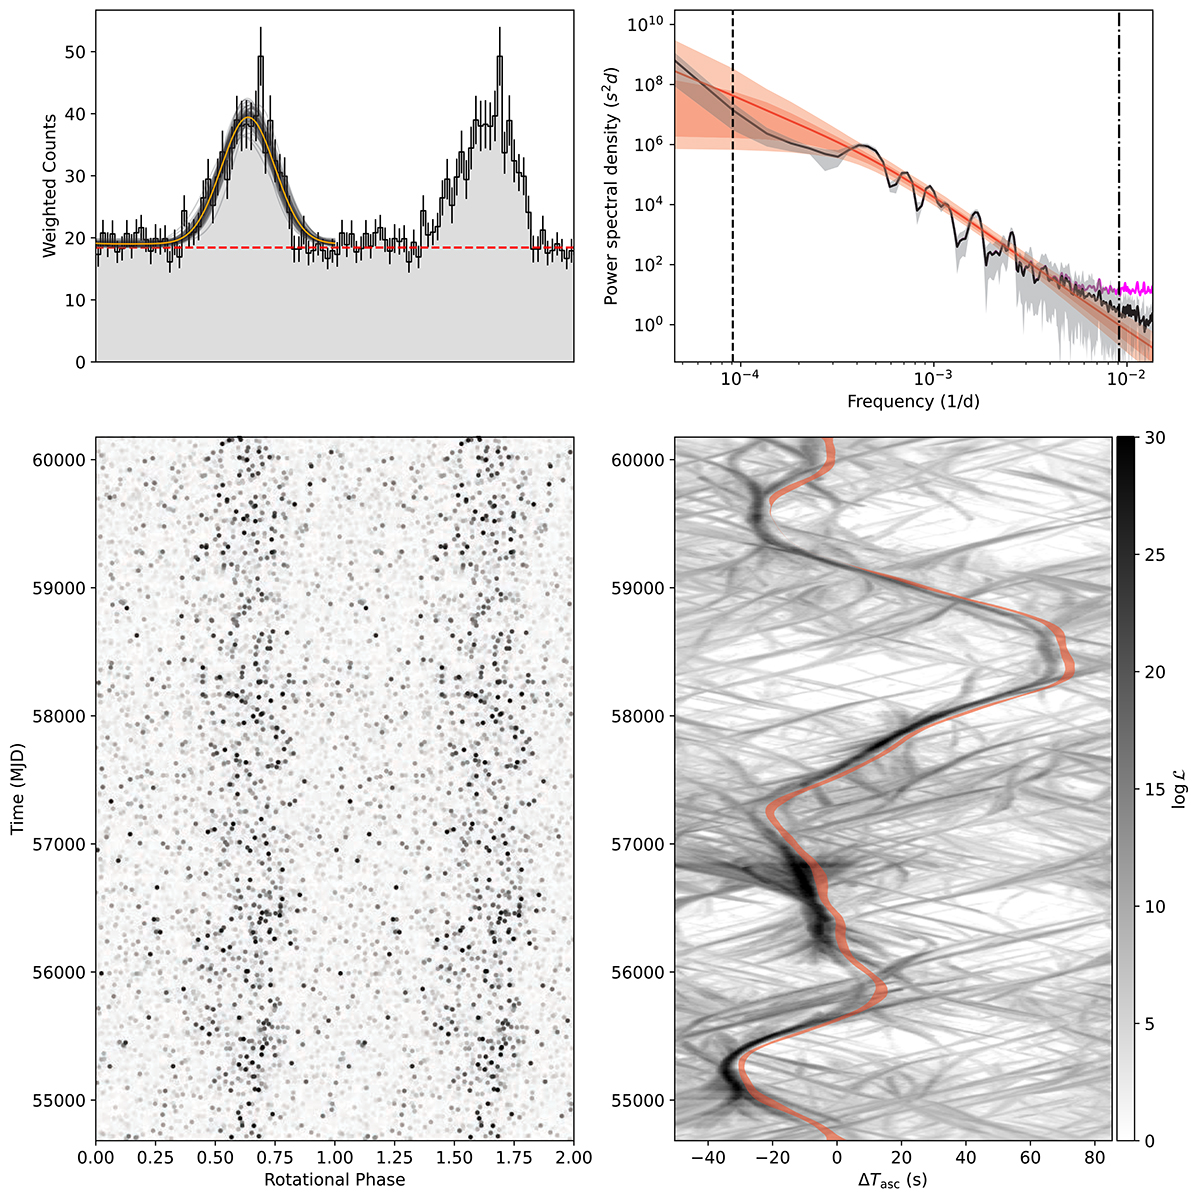
Gamma ray pulsations and orbital phase variations over the course of the Fermi-LAT data for PSR J1803−6707. The panels on the left show the weighted gamma-ray photon phases for the highest-likelihood timing solution (lower panel) and the integrated pulse profile (upper panel). The orange and the 100 faint black curves represent the associated highest-likelihood pulse-profile template and randomly drawn samples from the Monte Carlo analysis to visualise the uncertainty on the pulse-profile template. The bottom-right panel shows the orbital phase variations as a function of time. The grey-scale image shows the log-likelihood for offsets from the pulsar’s Tasc as measured in overlapping 800-day windows. The red curves represent the 95% confidence interval on those deviations, obtained from Monte Carlo timing analysis, with a 5 s-offset for clarity. The top-right panel shows the power spectral density of the orbital phase variations. The red shaded regions illustrate the 68% and 95% confidence intervals of the Matérn model. The black curve and grey shaded region show the estimated power spectrum and its 95% confidence interval from the joint radio and gamma-ray fitting, while the magenta curve, mostly hidden behind the black one, shows the power spectrum estimated from gamma-ray timing alone. The magenta curve is added to emphasise the increased sensitivity at higher frequencies caused by utilising the radio data.
Current usage metrics show cumulative count of Article Views (full-text article views including HTML views, PDF and ePub downloads, according to the available data) and Abstracts Views on Vision4Press platform.
Data correspond to usage on the plateform after 2015. The current usage metrics is available 48-96 hours after online publication and is updated daily on week days.
Initial download of the metrics may take a while.