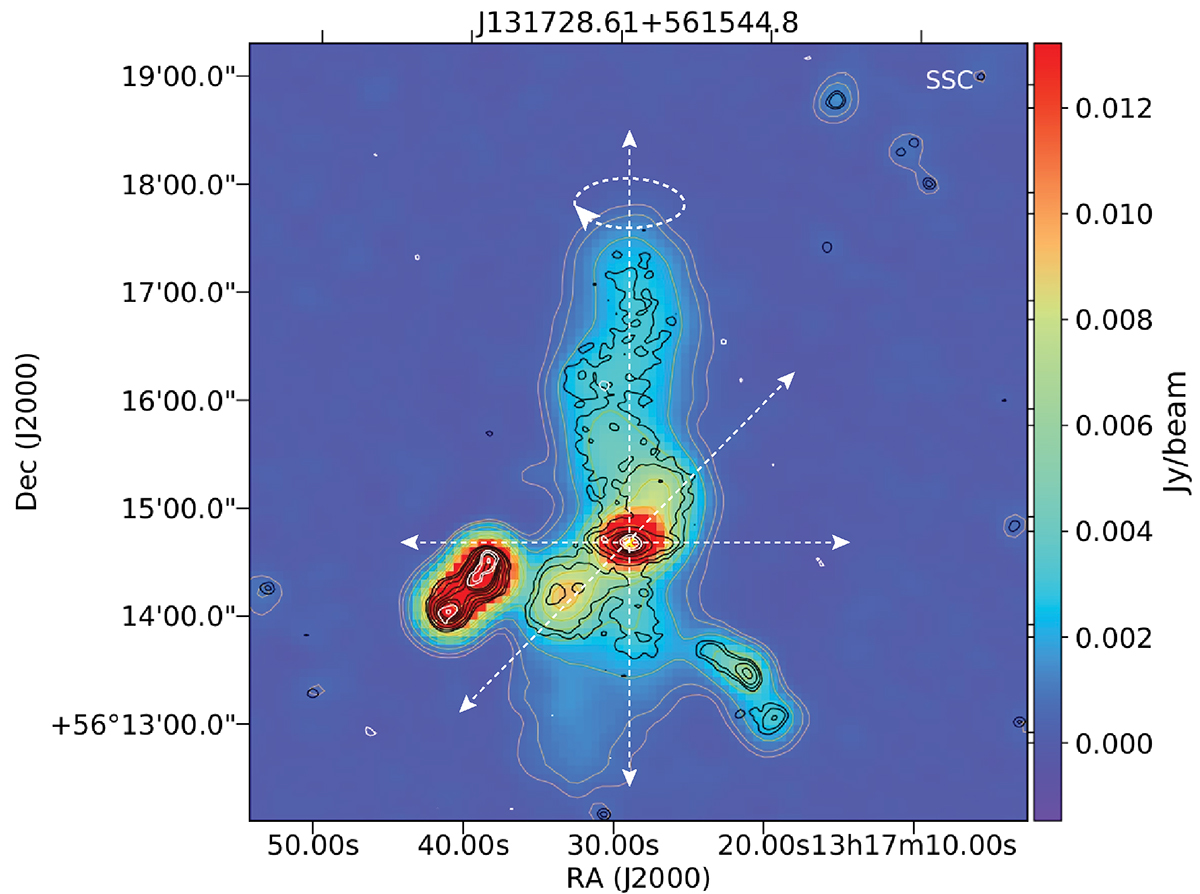
Fig. 8.
Download original image
Map of J131728.61+561544.8 which is an interesting case of restarting activity in the sample presented. An ongoing jet realignment in this source is clearly seen in its morphology (see Sect. 4.1). The directions of jet precession are depicted by three axes, with an arrow indicating clockwise precession of the jet. The various contours represent: VLA FIRST radio contours (white), and LOFAR radio contours of the high-resolution maps (black) are overlaid on the LOFAR 20″ resolution maps (orange). The host galaxy position is marked with a yellow cross.
Current usage metrics show cumulative count of Article Views (full-text article views including HTML views, PDF and ePub downloads, according to the available data) and Abstracts Views on Vision4Press platform.
Data correspond to usage on the plateform after 2015. The current usage metrics is available 48-96 hours after online publication and is updated daily on week days.
Initial download of the metrics may take a while.